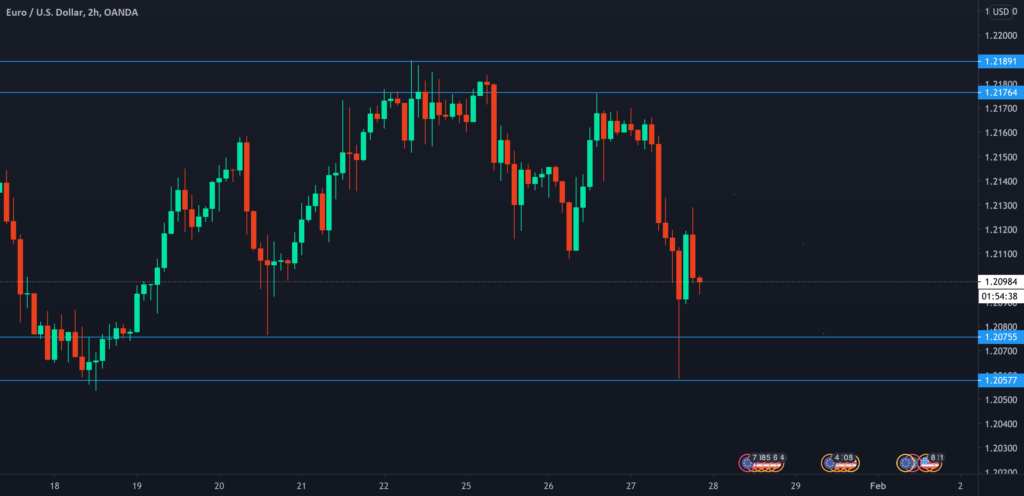
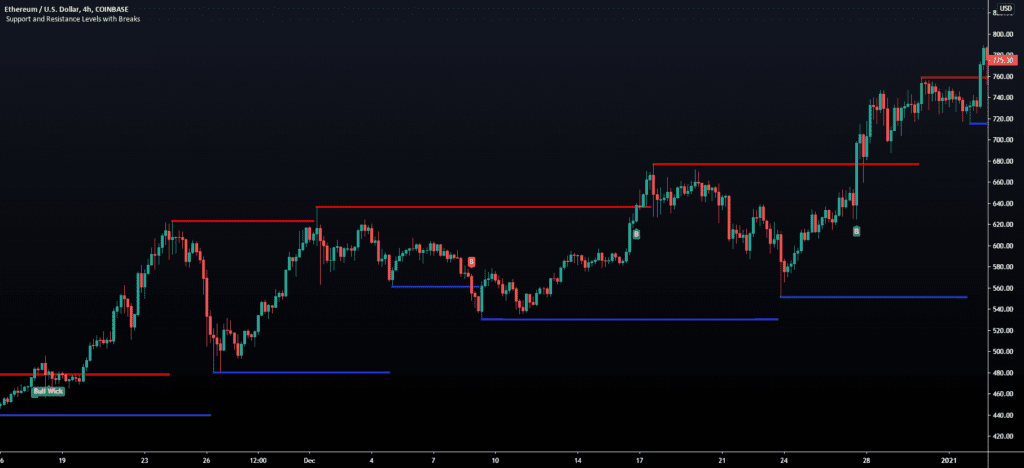
Finans ve kripto para piyasalarında destek ve direnç seviyeleri önemli indikatörlerdir. Bu seviyeler, yatırımcılar ve analistler için çok değerli bilgiler sunar.
- Trendlerin Belirlenmesi: Destek ve direnç seviyeleri, bir varlığın mevcut trendini belirlemede yardımcı olur. Fiyatlar destek seviyelerine yaklaştığında yukarı yönlü bir trend olabilir, direnç seviyelerine yaklaştığında ise aşağı yönlü bir trend olabilir.
- Alım ve Satım Noktalarının Belirlenmesi: Yatırımcılar, destek seviyelerine yaklaştığında varlıkları satın alabilirler, çünkü fiyatların bu seviyeden yükselme eğiliminde olduğu düşünülür. Benzer şekilde, direnç seviyelerine yaklaştığında varlıkları satmayı düşünebilirler, çünkü fiyatların bu seviyeden düşme eğiliminde olduğu düşünülür.
- Risk Yönetimi: Destek ve direnç seviyeleri, yatırımcılara stop-loss seviyelerini belirlemede yardımcı olabilir. Bir varlık destek seviyesinin altına düştüğünde veya direnç seviyesini aştığında, yatırımcılar pozisyonlarını kapatma kararı alabilirler.
Destek ve direnç seviyeleri ile ilgili bazı temel kavramlar şunlardır:
- Trend Çizgileri: Destek ve direnç seviyeleri, grafikler üzerinde trend çizgileriyle gösterilir. Destek çizgisi, fiyatların yukarı yönlü hareket ettiği bir çizgi olarak çizilirken, direnç çizgisi fiyatların aşağı yönlü hareket ettiği bir çizgi olarak çizilir.
- Grafik Formasyonları: Destek ve direnç seviyeleri, grafik formasyonlarının bir parçası olarak da görülebilir. Örneğin, ters omuz-baş-omuz veya bayrak formasyonları gibi fiyat hareketlerinin belirli desenleri, destek ve direnç seviyeleri ile ilişkilendirilebilir.
- Hacim: Destek ve direnç seviyeleri, hacimle birlikte analiz edildiğinde daha güçlüdür. Yüksek hacim, bir destek veya direnç seviyesinin daha güçlü olduğunu gösterebilir, çünkü daha fazla yatırımcı bu seviyeyi izliyor olabilir.
Destek ve direnç seviyeleri, finans ve kripto para piyasalarında fiyat hareketlerini analiz etmek ve kararlar almak için önemli araçlardır. Yatırımcılar ve analistler, bu seviyeleri dikkatlice izleyerek daha bilinçli yatırım kararları alabilirler.

Destek ve Direnç Seviyelerini Tanımlama Yolları:
- Grafik Analizi: Grafikler üzerinde fiyat hareketlerini inceleyerek destek ve direnç seviyelerini tanımlamak mümkündür. Fiyatlar belirli bir seviyeye yaklaştığında sık sık duruyor veya ters yönde dönüyorsa, bu seviye destek veya direnç olarak kabul edilebilir.
- Trend Çizgileri: Grafiklerdeki trend çizgileri, destek ve direnç seviyelerini görsel olarak tanımlamak için kullanılabilir. Yükselen bir trendde, destek çizgisi genellikle fiyatların yükseldiği bir çizgi olarak çizilirken, düşen bir trendde direnç çizgisi fiyatların düştüğü bir çizgi olarak çizilir.
- Önceki Zirve ve Dip Noktaları: Önceki zirve noktaları direnç seviyeleri olarak kullanılabilirken, önceki dip noktaları destek seviyeleri olarak kabul edilebilir. Bu noktalar geçmişte fiyatların durduğu ve tersine döndüğü yerlerdir.
Destek ve Direnç Seviyelerini Ticaret Stratejileri Geliştirmek İçin Kullanma:
- Breakout Stratejisi: Direnç seviyeleri fiyatların yükselmesini durdurduğu yerlerdir. Eğer fiyat direnç seviyesini aşarsa, bu bir “breakout” olarak adlandırılır ve yatırımcılar fiyatların yukarı yönlü bir trende girebileceğini düşünebilirler. Bu durumda, alım pozisyonu açmak düşünülebilir.
- Tersine Dönüş Stratejisi: Destek seviyeleri fiyatların düşmesini durdurduğu yerlerdir. Eğer fiyat destek seviyesinin altına düşerse, bu bir “tersine dönüş” olarak kabul edilebilir ve yatırımcılar fiyatların aşağı yönlü bir trende girebileceğini düşünebilirler. Bu durumda, satış pozisyonu açmak düşünülebilir.

Kripto Üzerinde Destek ve Direnç Seviyesi Örnekleri
- Tersine Dönüş Ticareti: Bitcoin (BTC) fiyatı uzun bir yükseliş trendinin ardından 60,000 dolar seviyesine ulaşırken bu seviyede dirençle karşılaşıyor. Bu direnç seviyesi, önceki zirve noktalarına işaret ediyor. Eğer BTC fiyatı 60,000 doların altına düşerse, bu bir tersine dönüş sinyali olabilir. Bu noktada, yatırımcılar satış pozisyonu açmayı düşünebilirler, çünkü fiyatların düşme eğiliminde olduğunu gösterebilir.
- Breakout Ticareti: Ethereum (ETH) fiyatı uzun süre boyunca 2,000 dolar seviyesinde dirençle karşılaşıyor ve bu seviyeyi aşamıyor. Ancak bir gün ETH fiyatı 2,000 doların üzerine çıkarsa, bu bir breakout olarak kabul edilebilir. Yatırımcılar bu noktada alım pozisyonu açmayı düşünebilirler, çünkü fiyatların yükseliş eğiliminde olduğunu ve yeni bir trendin başlayabileceğini düşünebilirler.
- Trend Çizgisi Kullanma: Ripple (XRP) fiyatı uzun bir düşüş trendinin ardından belirli bir trend çizgisine ulaşıyor ve bu çizgi üzerinde destek buluyor. Bu durumda, yatırımcılar bu trend çizgisini destek seviyesi olarak kabul edebilirler. Eğer XRP fiyatı bu çizginin altına düşerse, bu bir düşüş sinyali olabilir ve yatırımcılar satış pozisyonu açmayı düşünebilirler.
- Hacim İle Onaylama: Litecoin (LTC) fiyatı belirli bir direnç seviyesini test ediyor ancak bu seviyeyi aşamıyor. Ancak bu sırada işlem hacmi önemli ölçüde artıyor. Bu, direnç seviyesinin güçlenmekte olduğunu gösterebilir. Eğer LTC fiyatı bu seviyeyi aşarsa ve yüksek hacimle işlem görürse, yatırımcılar bu kırılma işaretini güçlü bir alım sinyali olarak kabul edebilirler.
Bu örnekler, destek ve direnç seviyelerinin kripto para ticaretinde nasıl kullanılabileceğini göstermektedir. Ancak, her ticaret stratejisi risk içerir ve yatırımcılar piyasa koşullarını ve risklerini dikkatlice değerlendirmelidirler. Ayrıca, teknik analiz araçlarının yanı sıra temel analiz ve duygu analizi gibi diğer faktörleri de göz önünde bulundurmak önemlidir.
Önemli Noktalar:
- Destek seviyeleri, varlık fiyatlarının düşerken durup yükselme eğilimine girdiği seviyeleri temsil ederken, direnç seviyeleri varlık fiyatlarının yükselirken durup düşüş eğilimine girdiği seviyeleri temsil eder.
- Destek ve direnç seviyeleri, finans ve kripto para gibi piyasalarda büyük bir öneme sahiptir. Bu seviyeler, trendleri belirlemek, alım-satım noktalarını belirlemek ve risk yönetimi yapmak için kullanılır.
- Destek ve direnç seviyelerini tanımlamanın farklı yolları vardır, bunlar grafik analizi, trend çizgileri ve önceki zirve/dip noktalarını içerir.
- Destek ve direnç seviyeleri, ticaret stratejileri geliştirmek için kullanılabilir. Tersine dönüş ticareti ve breakout ticareti gibi stratejiler destek ve direnç seviyelerini kullanır.
- Destek ve direnç seviyelerini kullanırken hacim gibi diğer faktörlerle birlikte analiz yapmak daha güçlü sinyaller elde etmeye yardımcı olabilir.


