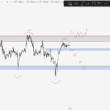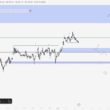


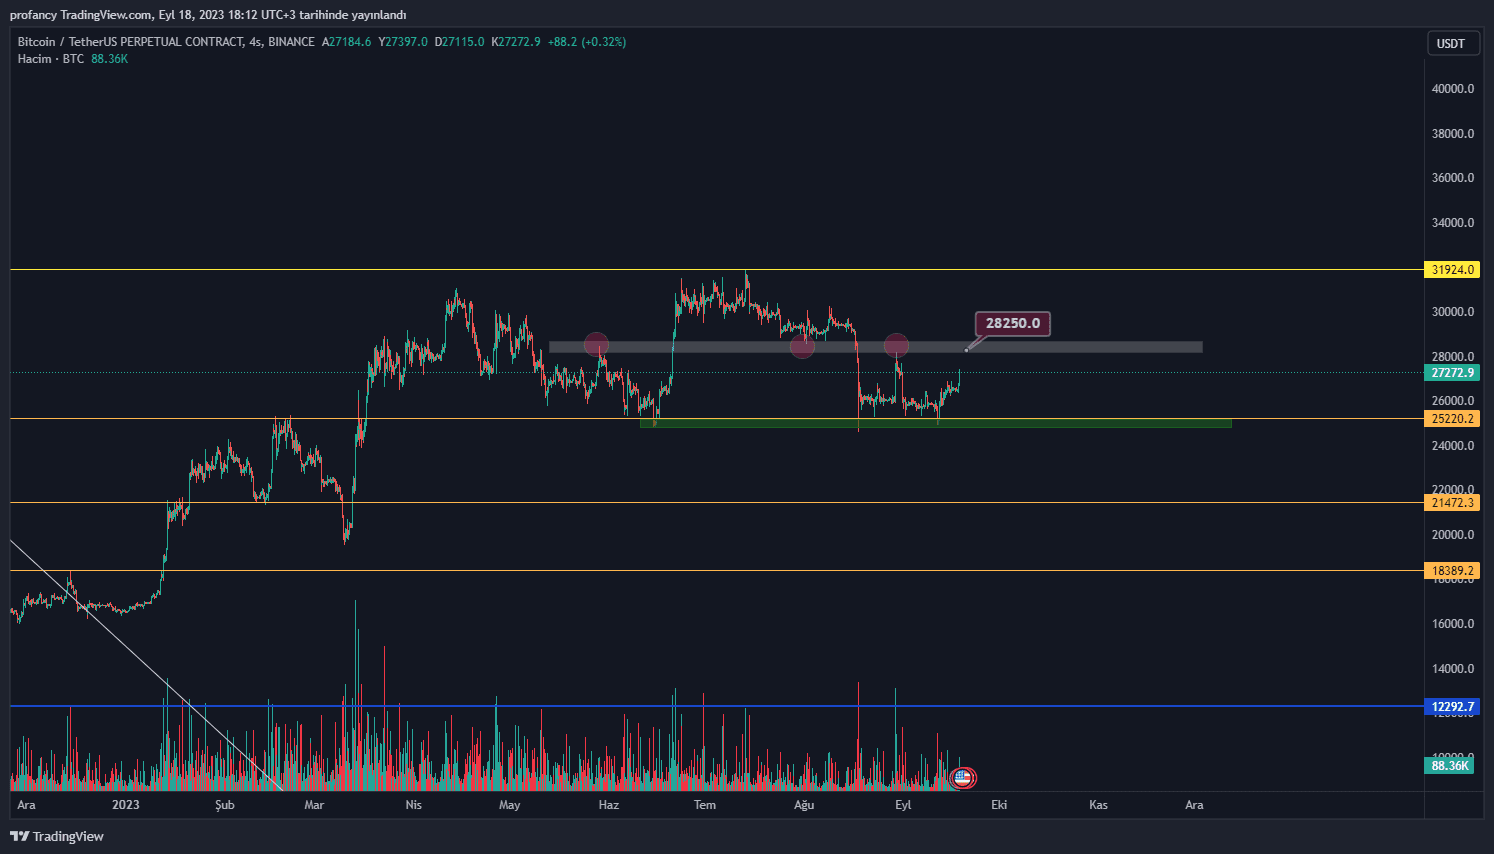
Bir önceki BTC analizimizde belirtilen 25k$ Seviyesi altında günlük kapanış yapmayarak tutunmayı başaran BTC bir sonraki direnç seviyelerine doğru yükselişe başlayarak %8 e yakın bir ivme kazandı.
Görselde görüldüğü gibi markete olası bir olumsuz haber ve benzeri durum gelmediği sürece öncelikli hedef bölgesi gözüken 28k-28.5k$ olan S/R flip (desteğin dirence, direncin desteğe dönüştüğü fiyat bölgesi) bölgesini test etmek isteyecektir.
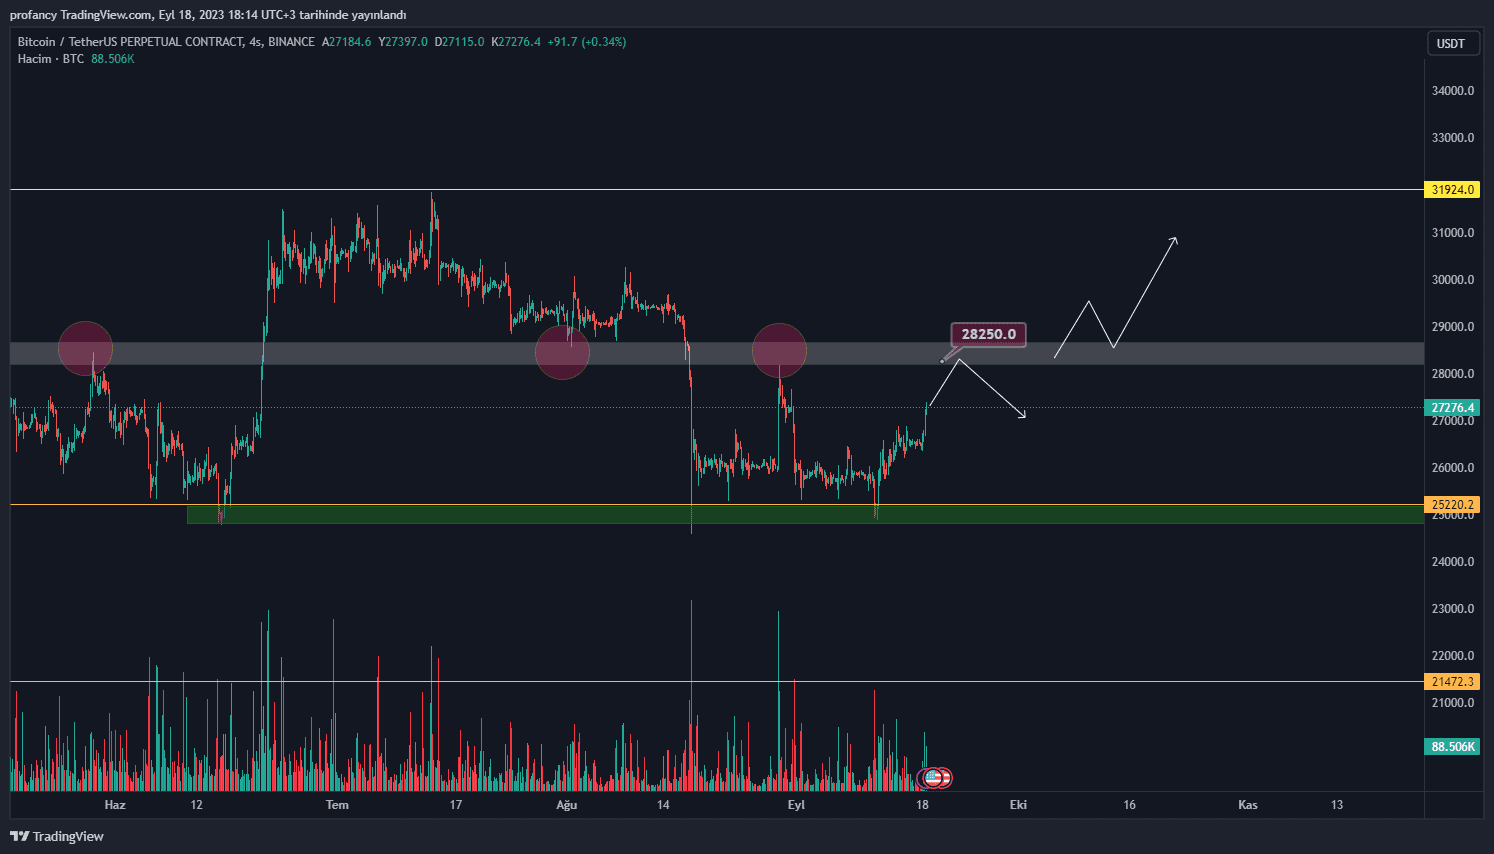
Direncin kırılması halinde ara dirençler dışında hedefleyeceği bölge 32k$ seviyesi olarak gözükmekte. S/R flipler markette çok fazla karşımıza çıkan ve çalışan fiyat hareketleridir.
Bu bölgeden red yemesi halinde bir önceki analizimizde olduğu gibi ara destek bölgelerinde tutunamadığı sürece tekrardan 25k$ dolar bölgeleri geri çekilme beklenebilir.
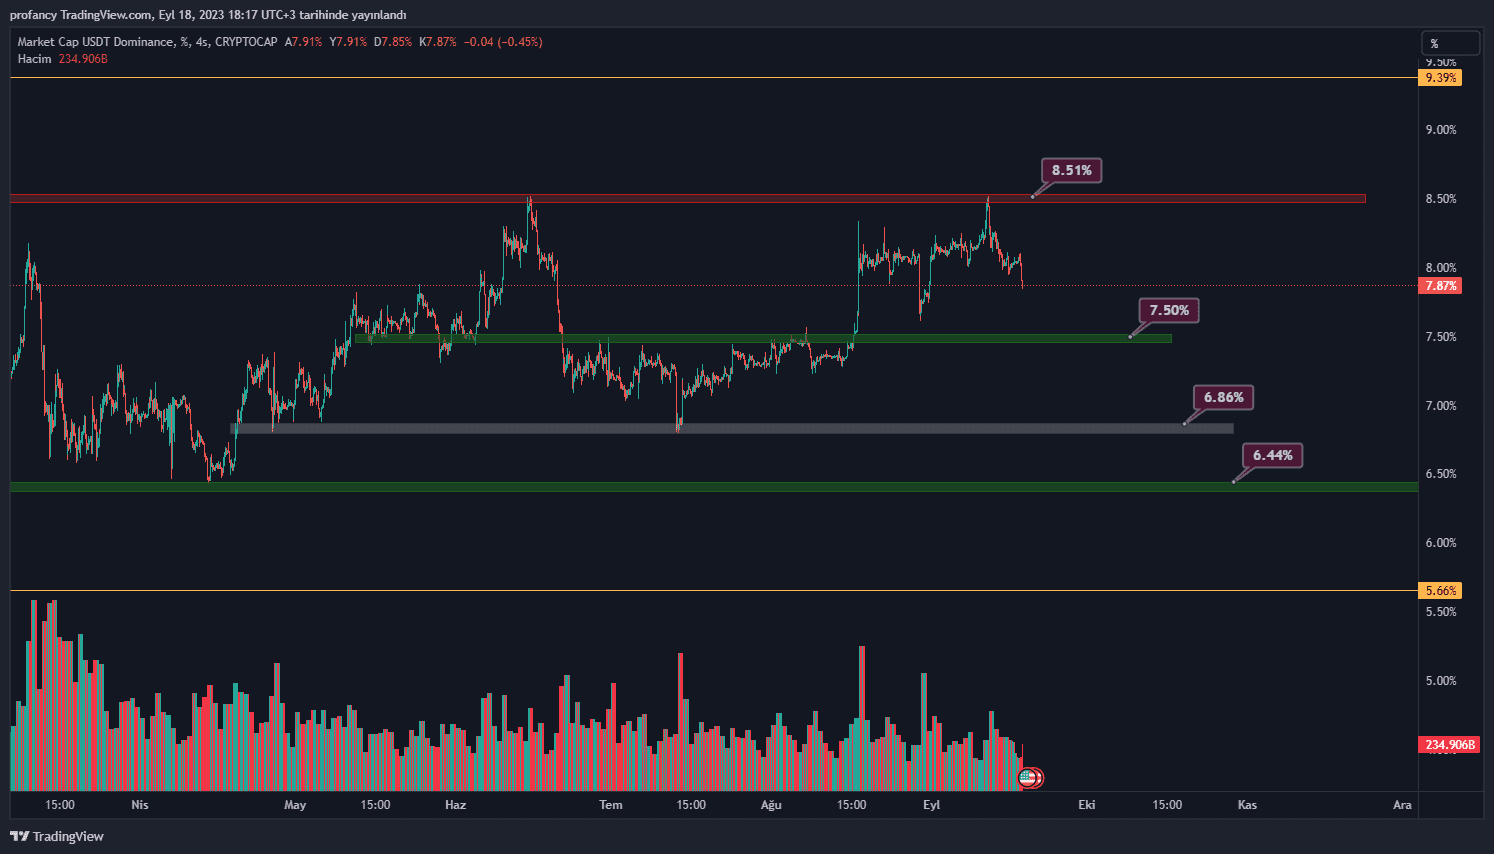
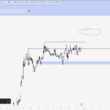
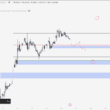
Her ne kadar Tether Dominance grafiğine göre işlem almasakta, işlemlere giriş çıkışlarımızda marketin nerelerden tepki alacağını anlayabilmemize yardımcı olan bir grafiktir.
Örneğin USDT.D’nin destek konumunda olduğu bir durumda ordan gelecek bir yükseliş ile birlikte marketin düşüş eğiliminde olmasını bekleyebiliriz. Ya da tam tersi olarak BTC nin bir destek bölgesinde USDT.D grafiğinin de bir direnç bölgesinde olduğunda gireceğimiz long yönlü işlemde yan indikatör olarak kullanabiliriz.
Görselde görüldüğü gibi USDT.D şuan bir ara destek bölgesinde durmakta. En son test ettiği %8.50 bölgesini kıramadığı sürece aşağılara doğru geri çekilmeler ile birlikte marketin yukarı yönlü harekine devam edebileceğini söyleyebiliriz.
Burada paylaşılan analizler yatırım tavsiyesi olmamakla beraber, piyasada kısa-orta vade işlem fırsatı verebileceğini düşünülen destek direnç seviyeleridir. İşlem alma ve risk yönetimi sorumluluğu kullanıcının kendisine aittir. Paylaşılan işlemlerde stop loss kullanmanız şiddetle tavsiye edilir.