


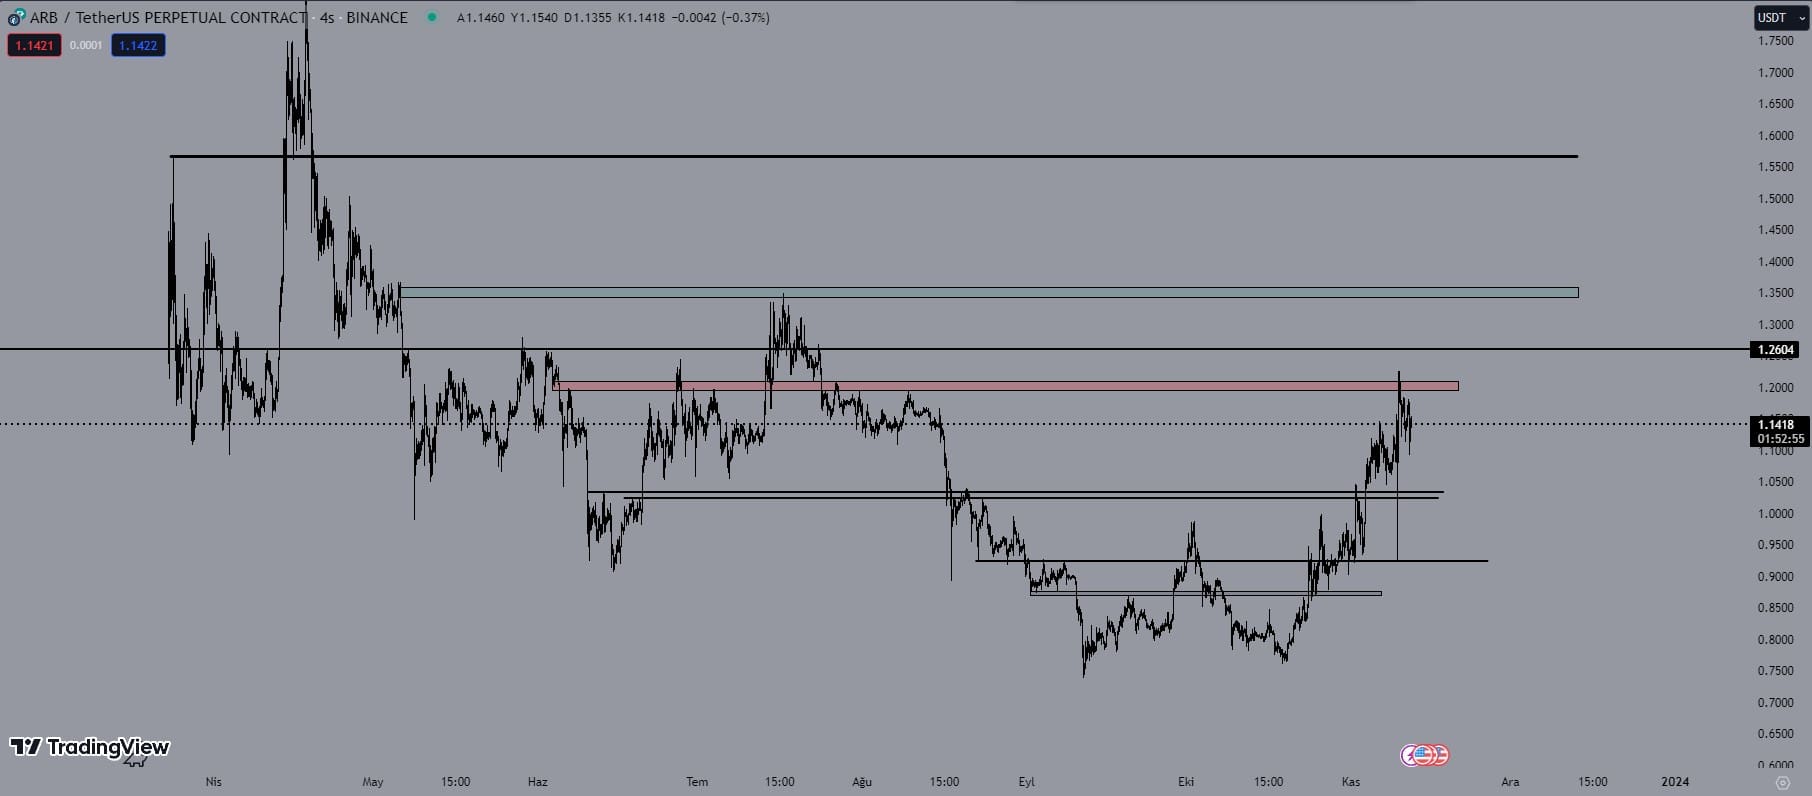
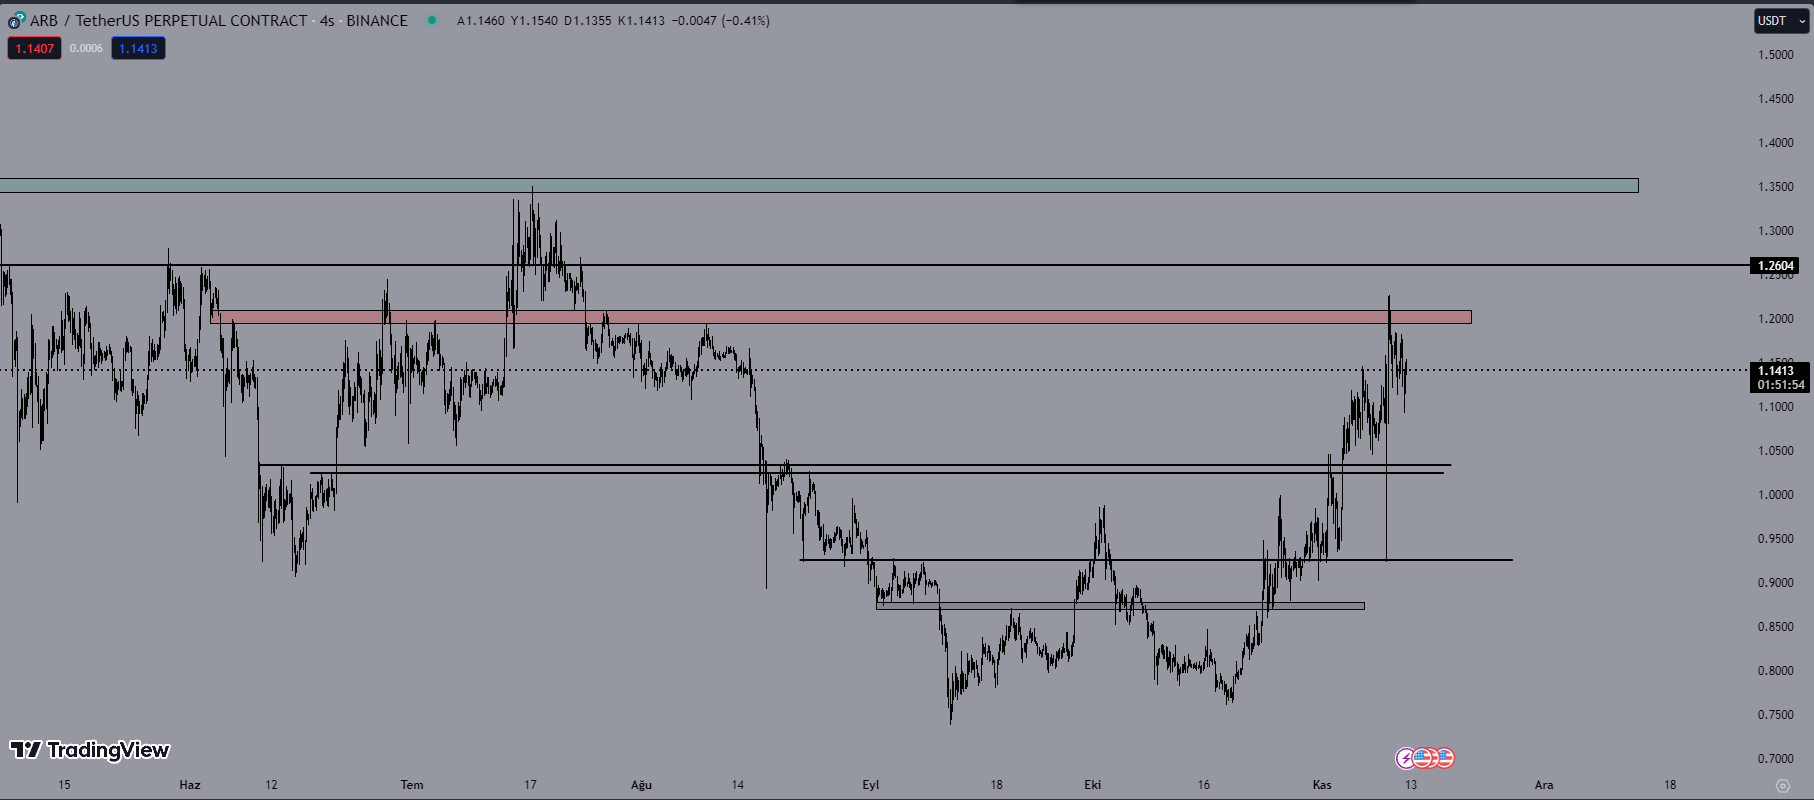
Güncel görünüme baktığımda 1.20$-1.21$ seviyesinin direnç olarak çalıştığını görüyoruz. Bu bölgenin kazanılması ile birlikte fiyat 1.34$-1.35$ seviyesini test etmek isteyecektir. O bölgenin de kazanılmasıyla fiyat 1.56$ seviyesine kadar yükseliş gerçekleştirebilir. Olası geri çekilmelerde ise 1.03$ seviyesi ilk takip ettiğim güçlü destek seviyesi. Fiyat yükselişine devam edecekse, bu seviyeyi kaybetmemesi gerekiyor diye düşünüyorum.
OP
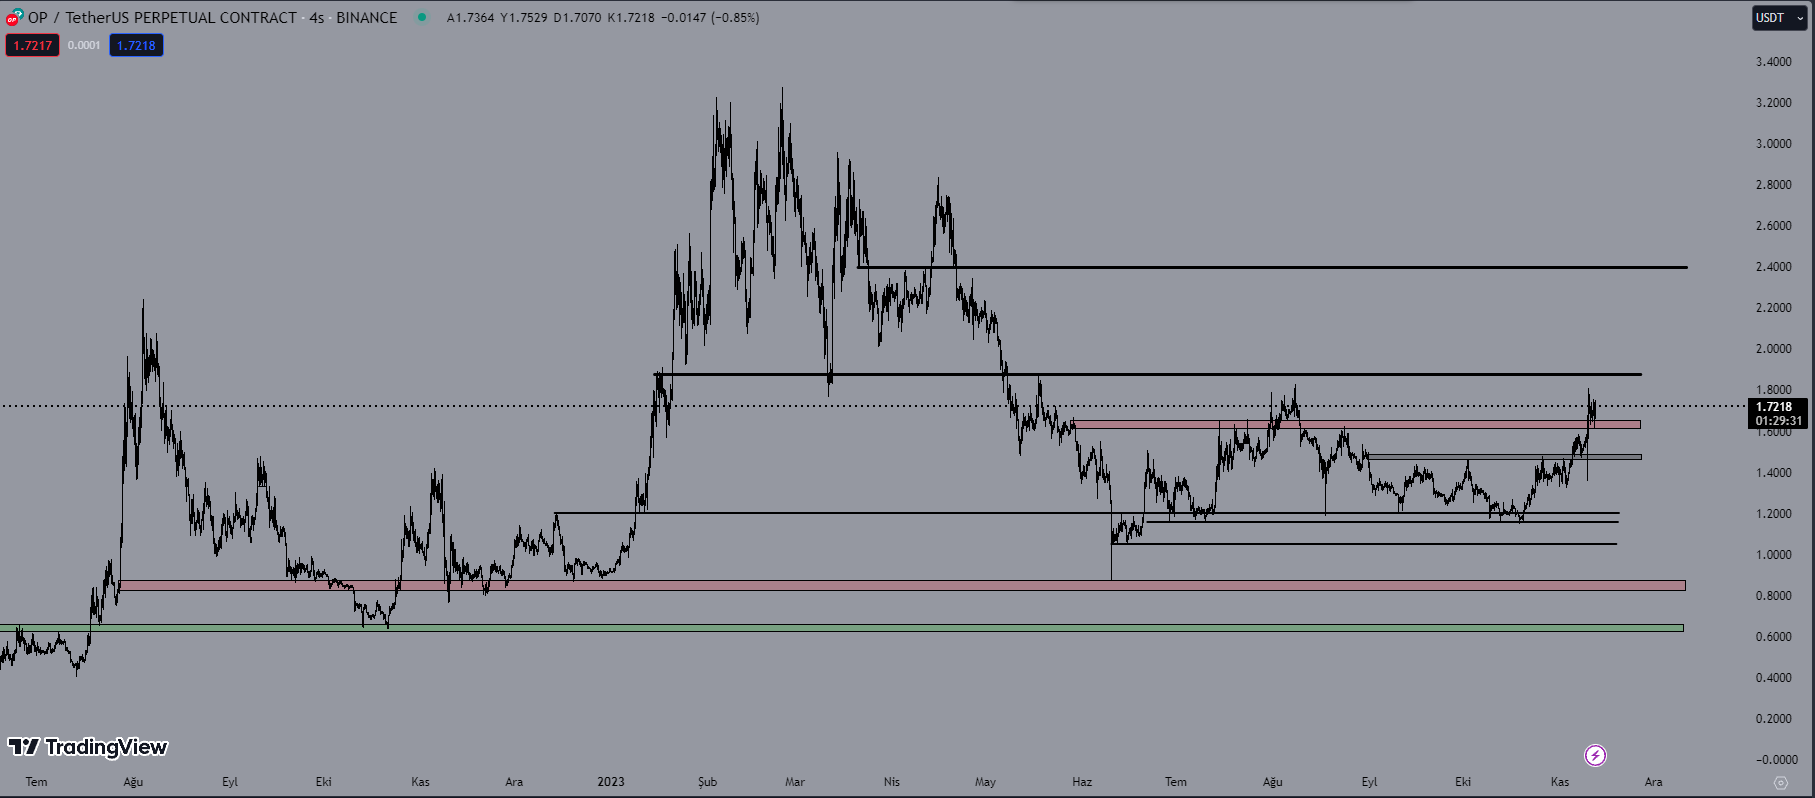
1.6350$ civarı ilk yatay destek seviyesi. Bu bölgeye retest verdi. Fiyatın ilk olarak 1.87$ seviyesini test etmesini bekliyorum. 1.83$ seviyesi ara direnç seviyesi. 1.87$ direncini kazanabilirse, 2.40$ seviyesine kadar bir sıçrama görebiliriz düşüncesindeyim. İkinci olarak takip ettiğim ana destek seviyesi 1.47$ seviyesi. Piyasa bullish olduğu sürece geri çekilmeleri alım fırsatı olarak görmeye devam edeceğim.
Burada paylaşılan analizler yatırım tavsiyesi olmamakla beraber, piyasada kısa-orta vade işlem fırsatı verebileceğini düşünülen destek direnç seviyeleridir. İşlem alma ve risk yönetimi sorumluluğu kullanıcının kendisine aittir. Paylaşılan işlemlerde stop loss kullanmanız şiddetle tavsiye edilir.