


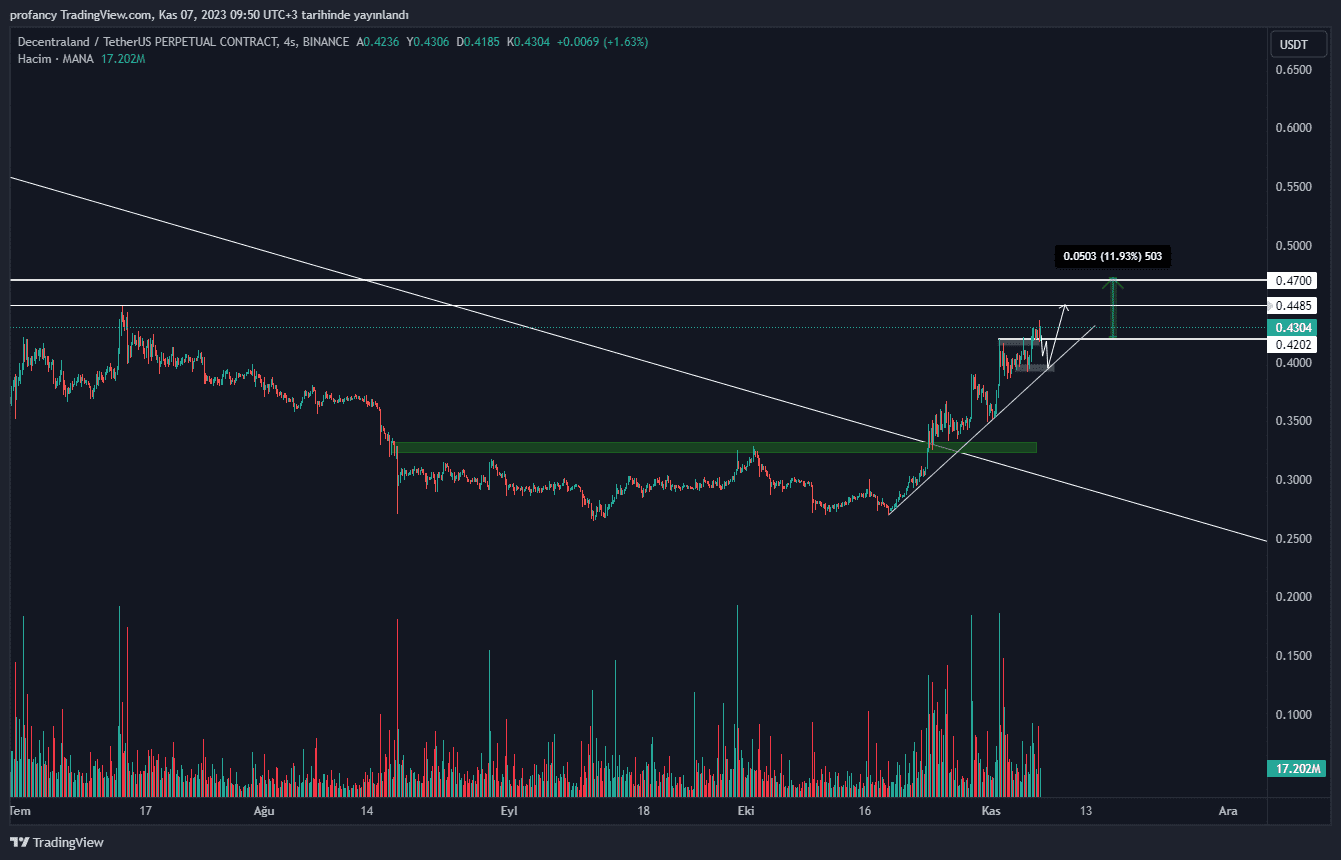
Piyasanın olumlu gittiği bu günlerde Metaverse projelerin gözdelerinden Sand ve Mana henüz diğer alt coinlere göre hareketini yapmamış gözükmekte.
Üstteki grafikte görüldüğü gibi güzel bir yükseliş trendi oluşturmuş olan Mana long yönlü işlem için Trend teması takibe alınabilir.
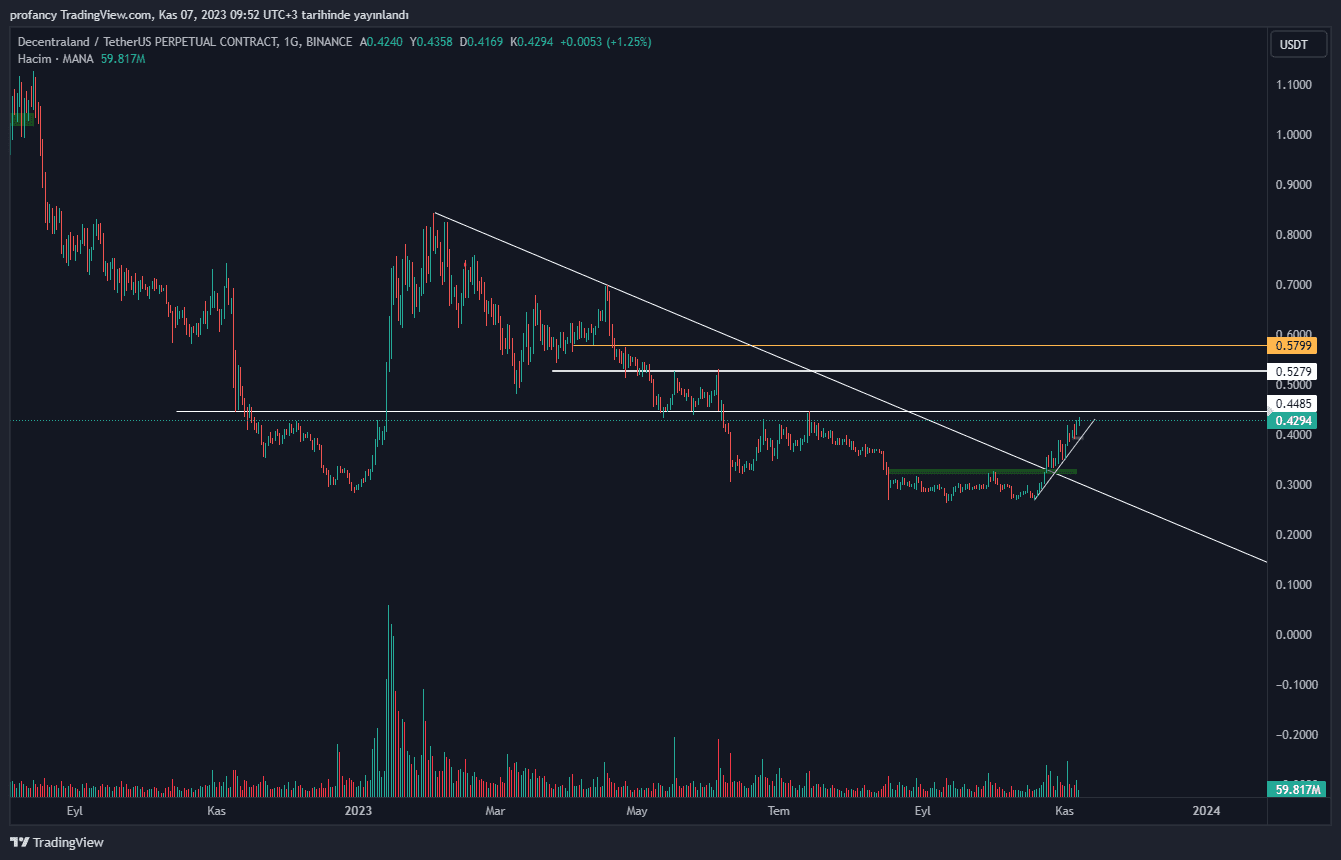
Günlük grafikte gözüktüğü gibi önemli direnç bölgesi olan $0.45 bölgesini kazanması ardından yeni bir long yönlü işlem ve de var olan işlemler için karşılaşacağı direnç bölgesi olacağından dolayı kâr alma yapılması daha doğru olacaktır.
Yükselişin devamı halinde $0.47 ve ardından $0.52 takip ettiğim direnç seviyeleri.
Markette yaşanacak düşüş ile birlikte güzel destek seviyeleri olarak $0.36 ardından ise $0.32 seviyeleri takip edilebilir.
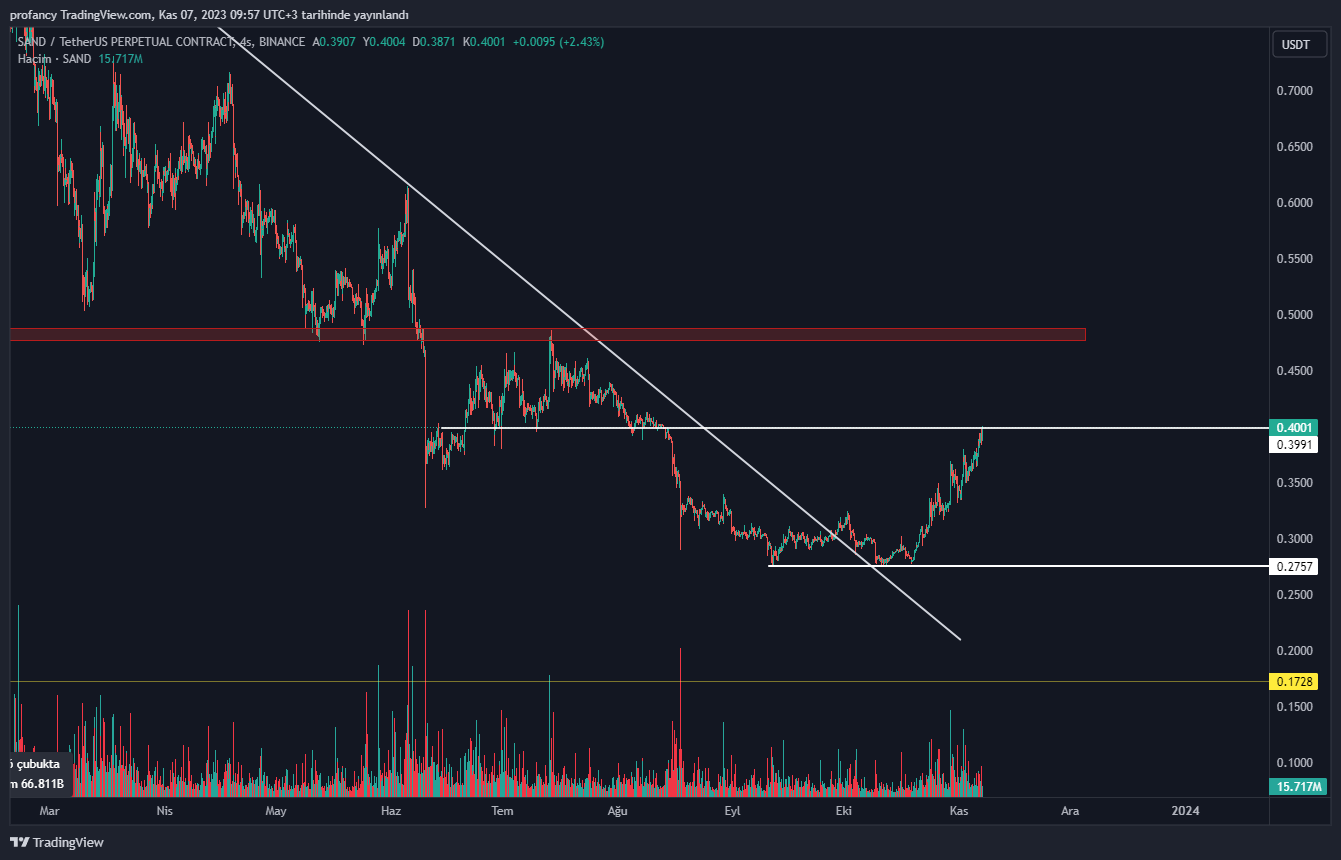
SAND
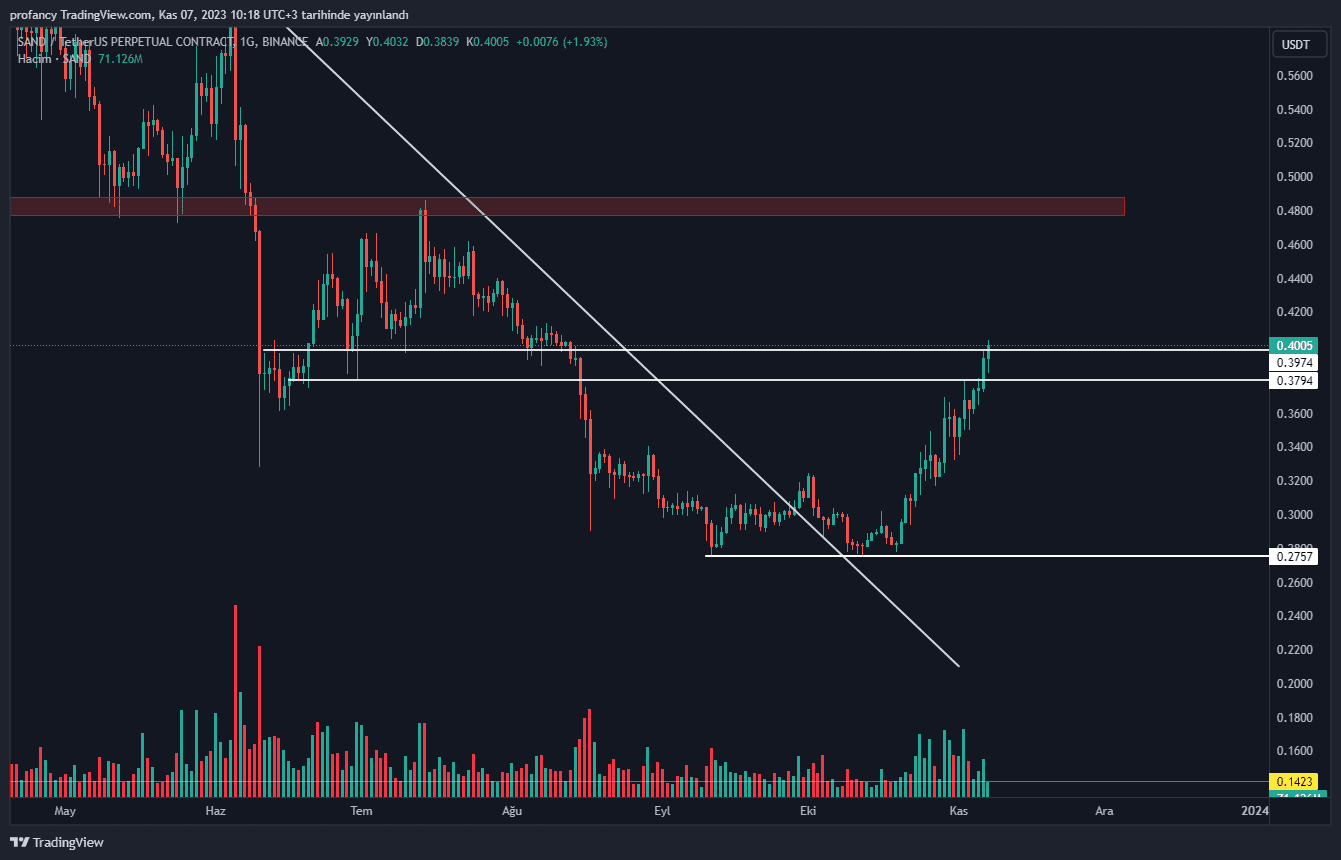
Sand 430 günlük bir düşen trend kırılımı ardından toplamda %50’lik bir yükseliş gerçekleştirdi.
Yükselişin devamı için önemli gördüğüm $0.40 seviyesine kadar dayandı.
Bu bölge üzerinde 4h kapanışlar yaparak tutunması halinde. Ara bölge olan $0.44 seviyesi öncelik, ardından ise $0.48 seviyelerini hedefleyecektir.
Fakat Bitcoinin şuanki durumundan dolayı buradan red yemesi halinde. Öncelikle marketin genel durumuna göre yeni bir yükseliş için önce $0.38 seviyesi, düşüşün devamı halinde $0.33 seviyesine kadar bir geri çekilme beklenebilir. Direnç bölgelerinin aşağıdan maliyetlenenler için kâr alma bölgeleri olarak değerlendirilmelidir.
Burada paylaşılan analizler yatırım tavsiyesi olmamakla beraber, piyasada kısa-orta vade işlem fırsatı verebileceğini düşünülen destek direnç seviyeleridir. İşlem alma ve risk yönetimi sorumluluğu kullanıcının kendisine aittir. Paylaşılan işlemlerde stop loss kullanmanız şiddetle tavsiye edilir.