


RNDR
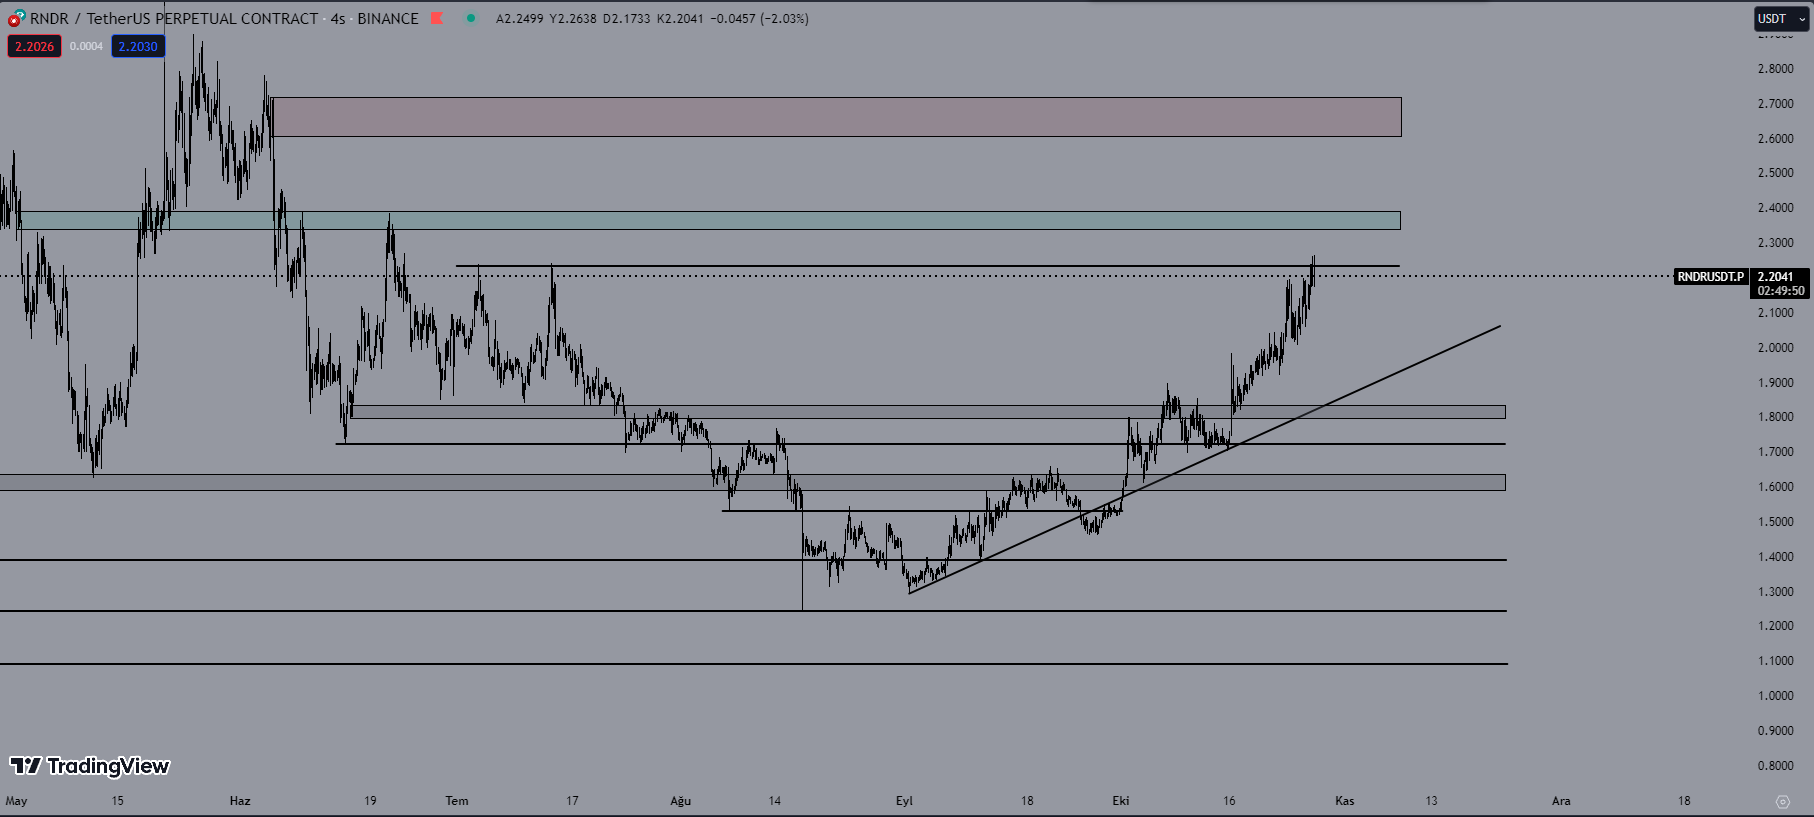
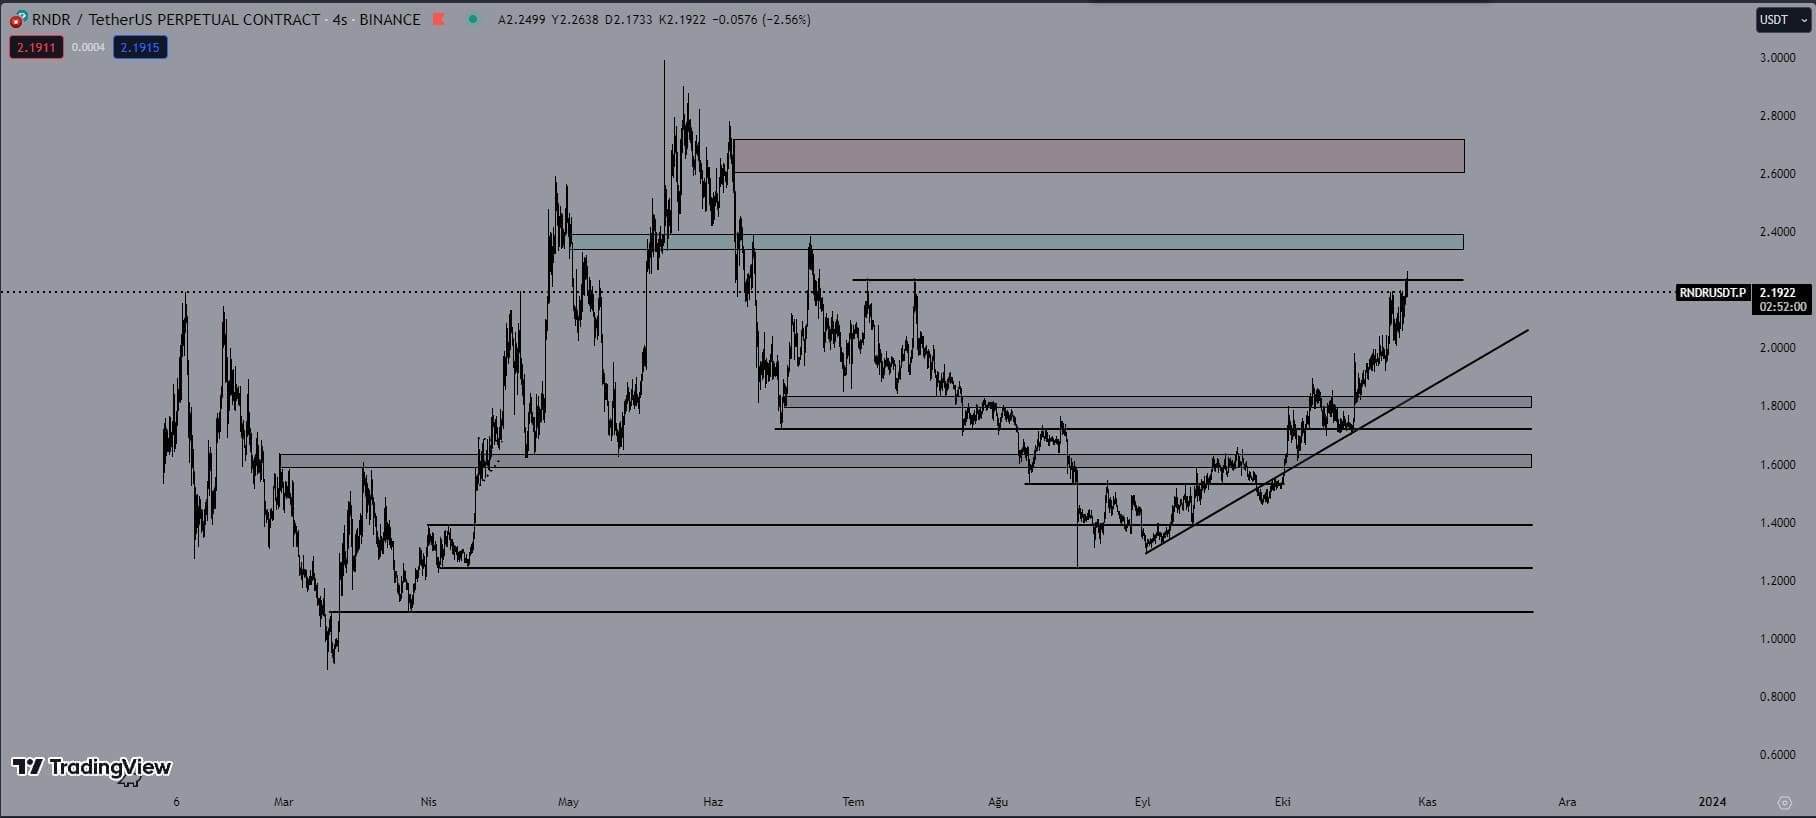
BTC yükselişinden önce yukarı yönlü hareketine başlayan RNDR, şuan için 2.24$ direnç seviyesinden red yemiş gözüküyor. 2.24$ direncini kırarsa takip edeceğim ilk direnç seviyesi 2.38$ seviyeleri ardından 2.65$ seviyeleri olacaktır. Yükselirken çok fazla likidite bıraktığını görüyoruz grafik üzerinde. Takip ettiğim destek seviyesi ise 1.81$-1.82$ seviyesi.
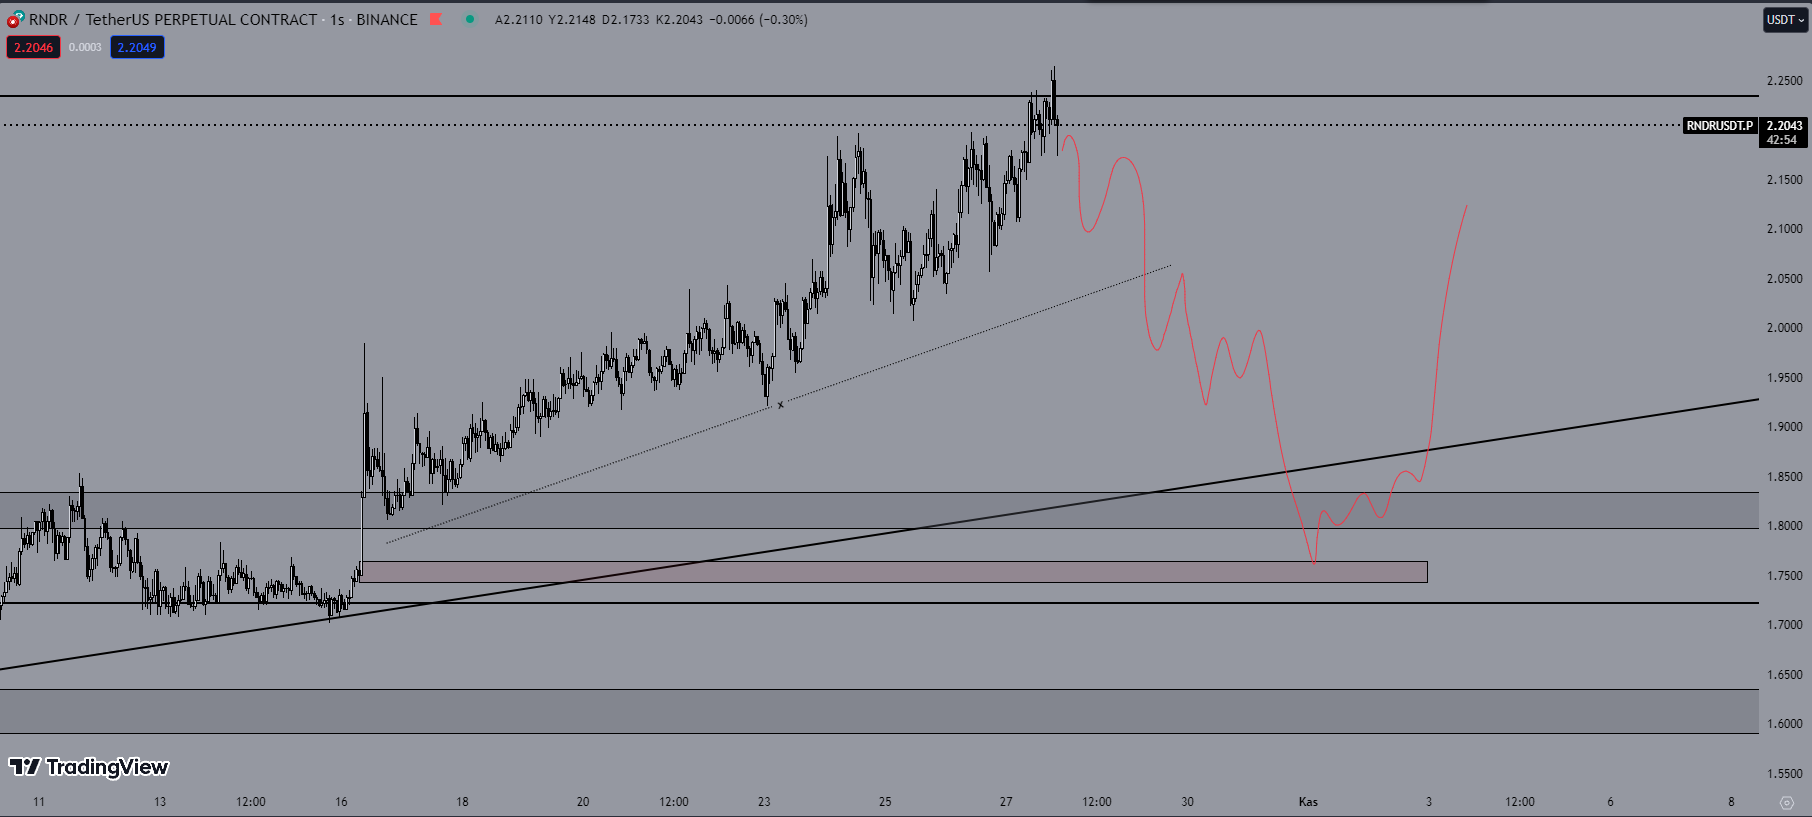
Düşük zaman diliminde incelediğim zaman ise, fiyatın yukarı yönlü hareketini yaparken çok fazla açık likidite bıraktığını görüyorum. Sağlıklı bir yükseliş için bıraktığı likiditeleri temizleyip tekrardan yukarı yönlü hareketine devam etmesini beklerim. Long yönlü işlem almak isteyenlerin yukarıda ki görselde belirttiğim gibi bir fiyat hareketi oluşmasını beklemesini veya markette bir düzeltme hareketi beklemesini tavsiye ederim.
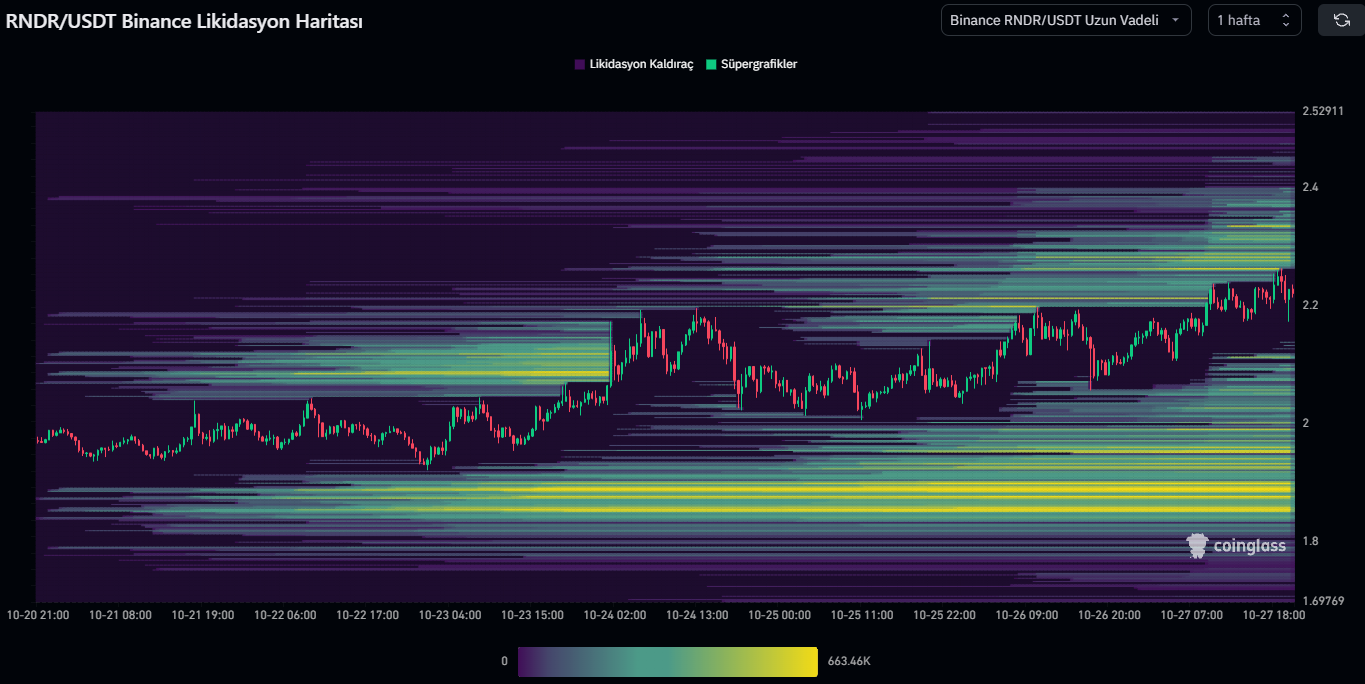
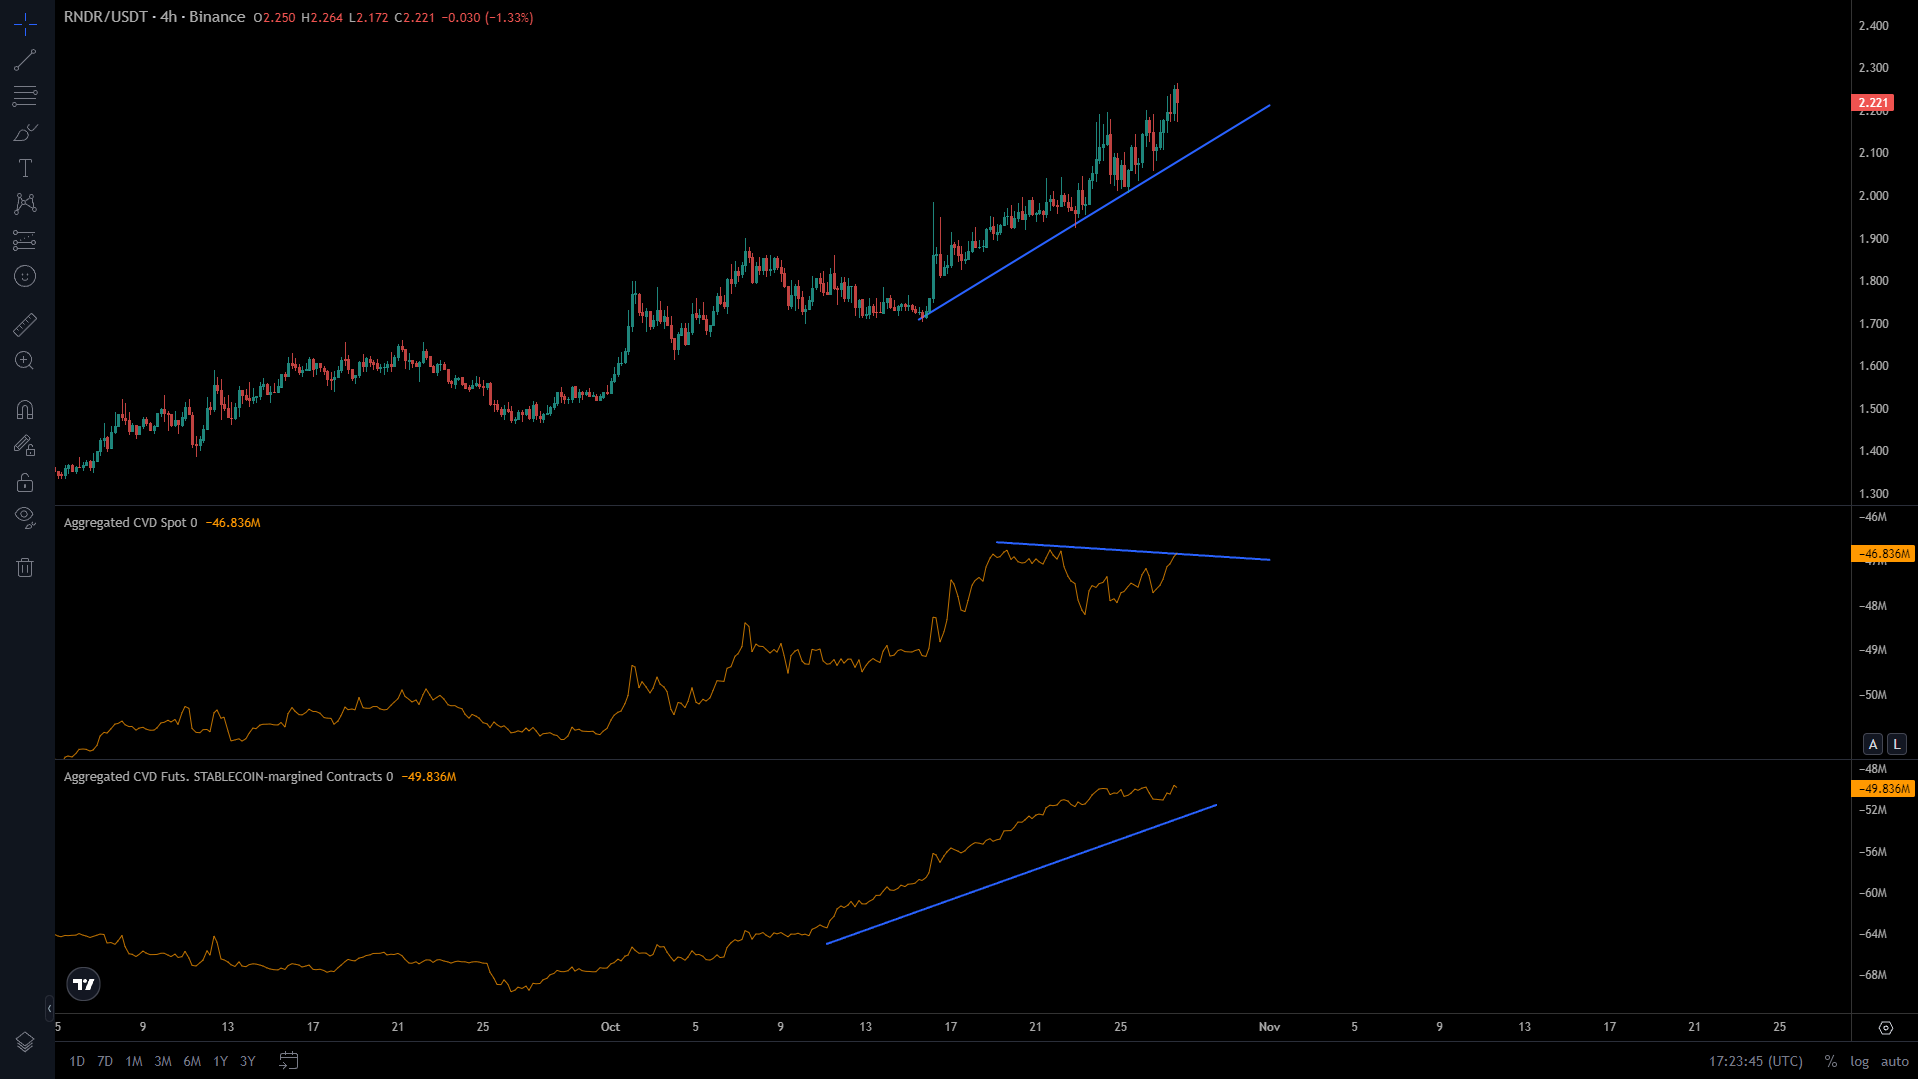
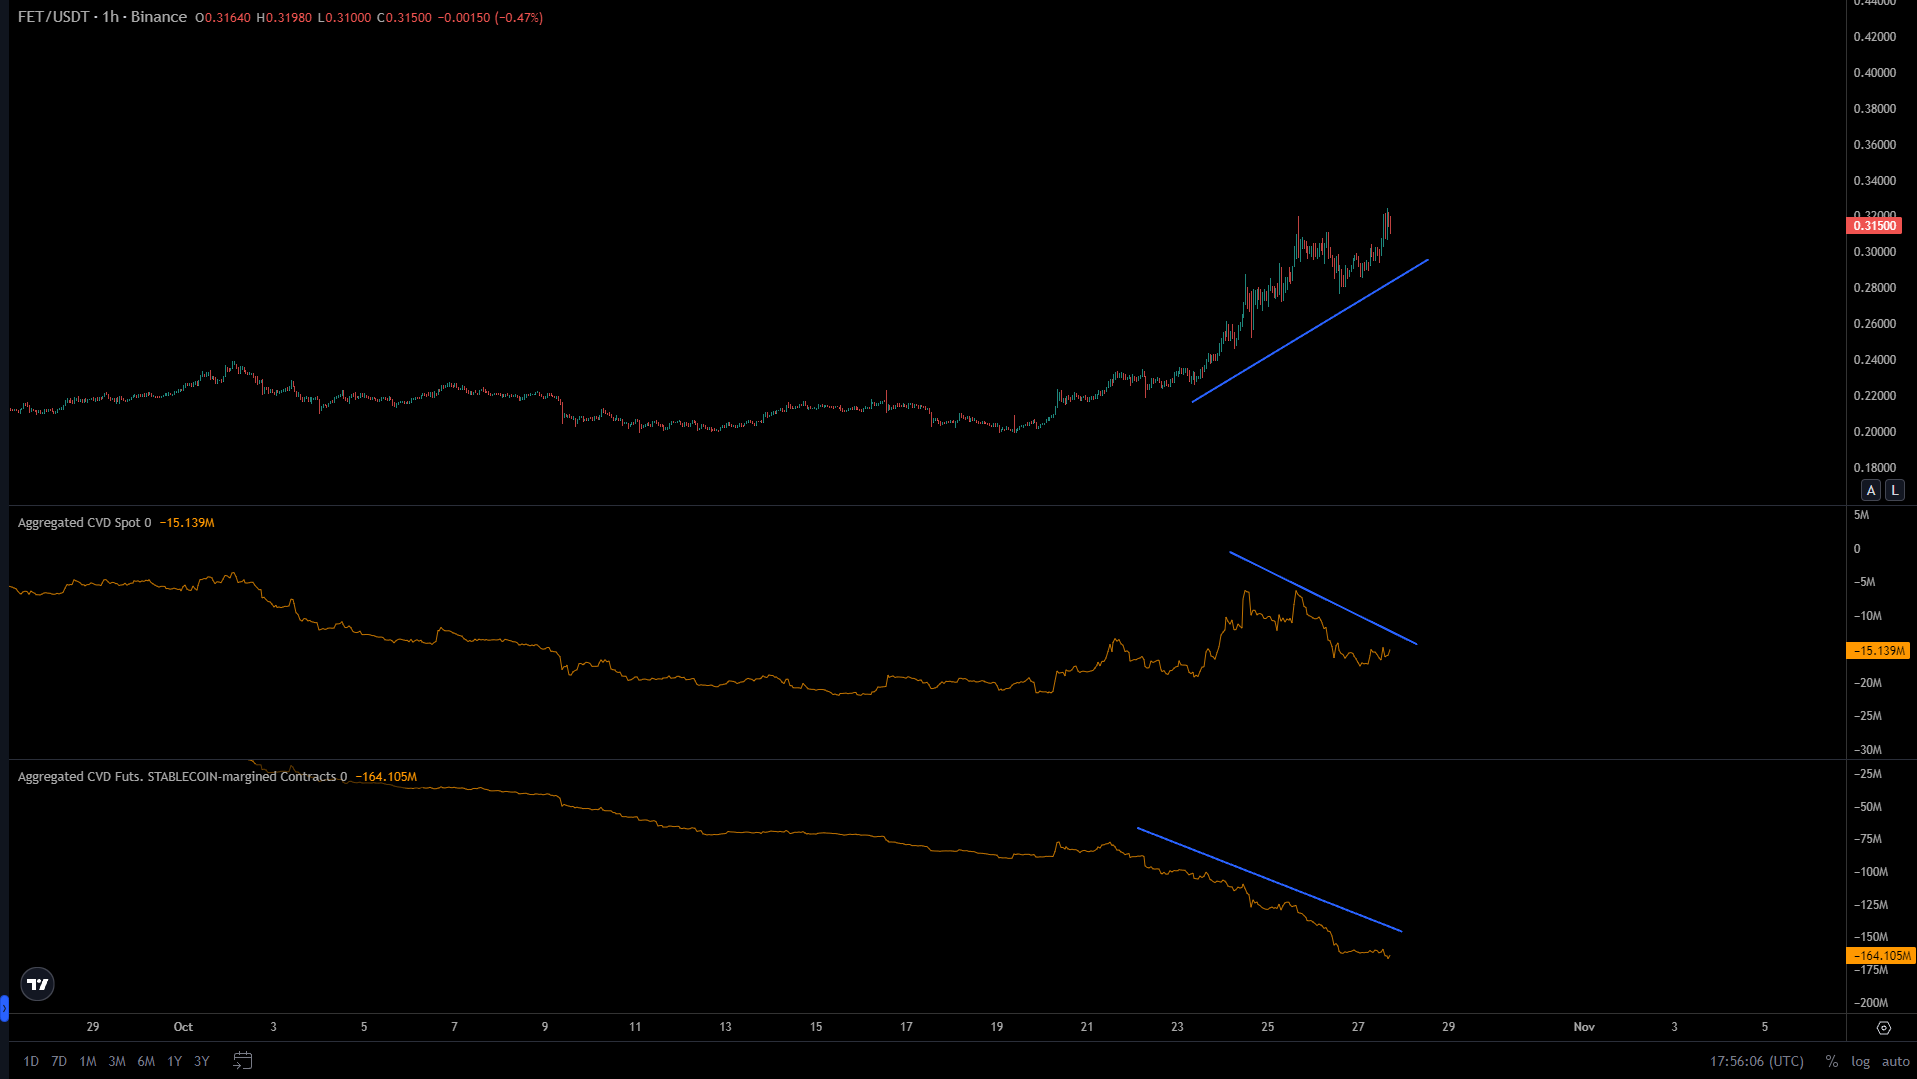
Son günlerde ki yükselişinin özellikle kaldıraçlı işlemler tarafından desteklendiğini yukarıda ki grafikte görebiliyoruz. Spot tarafta ki alıcılar bu seviyede biraz azalmış gözüküyor.
INJ
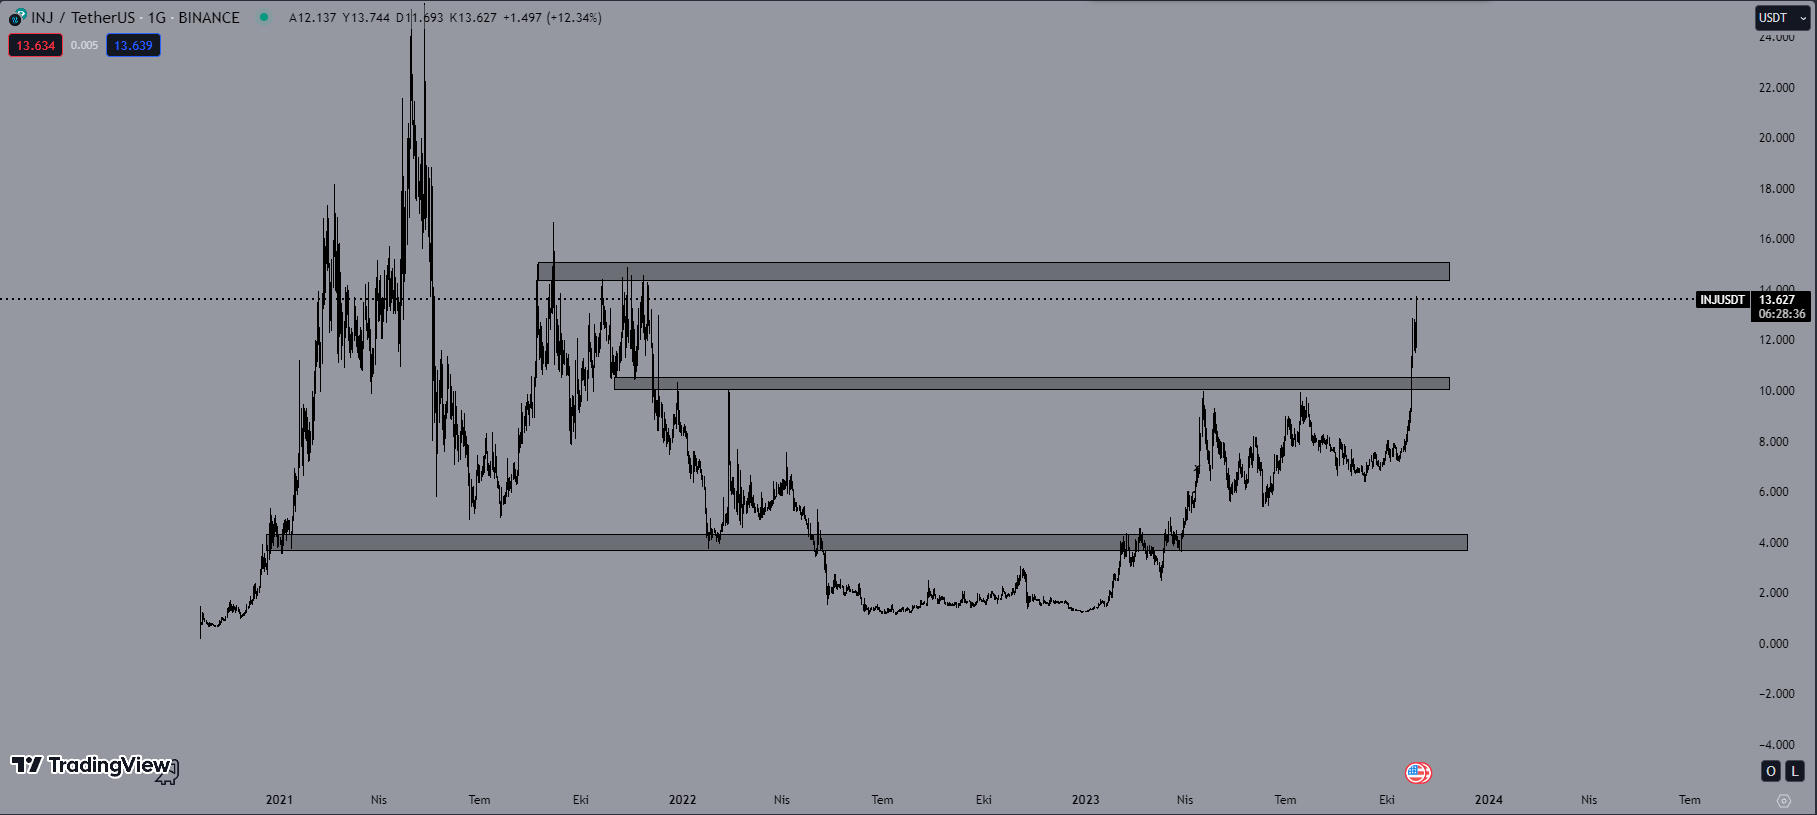
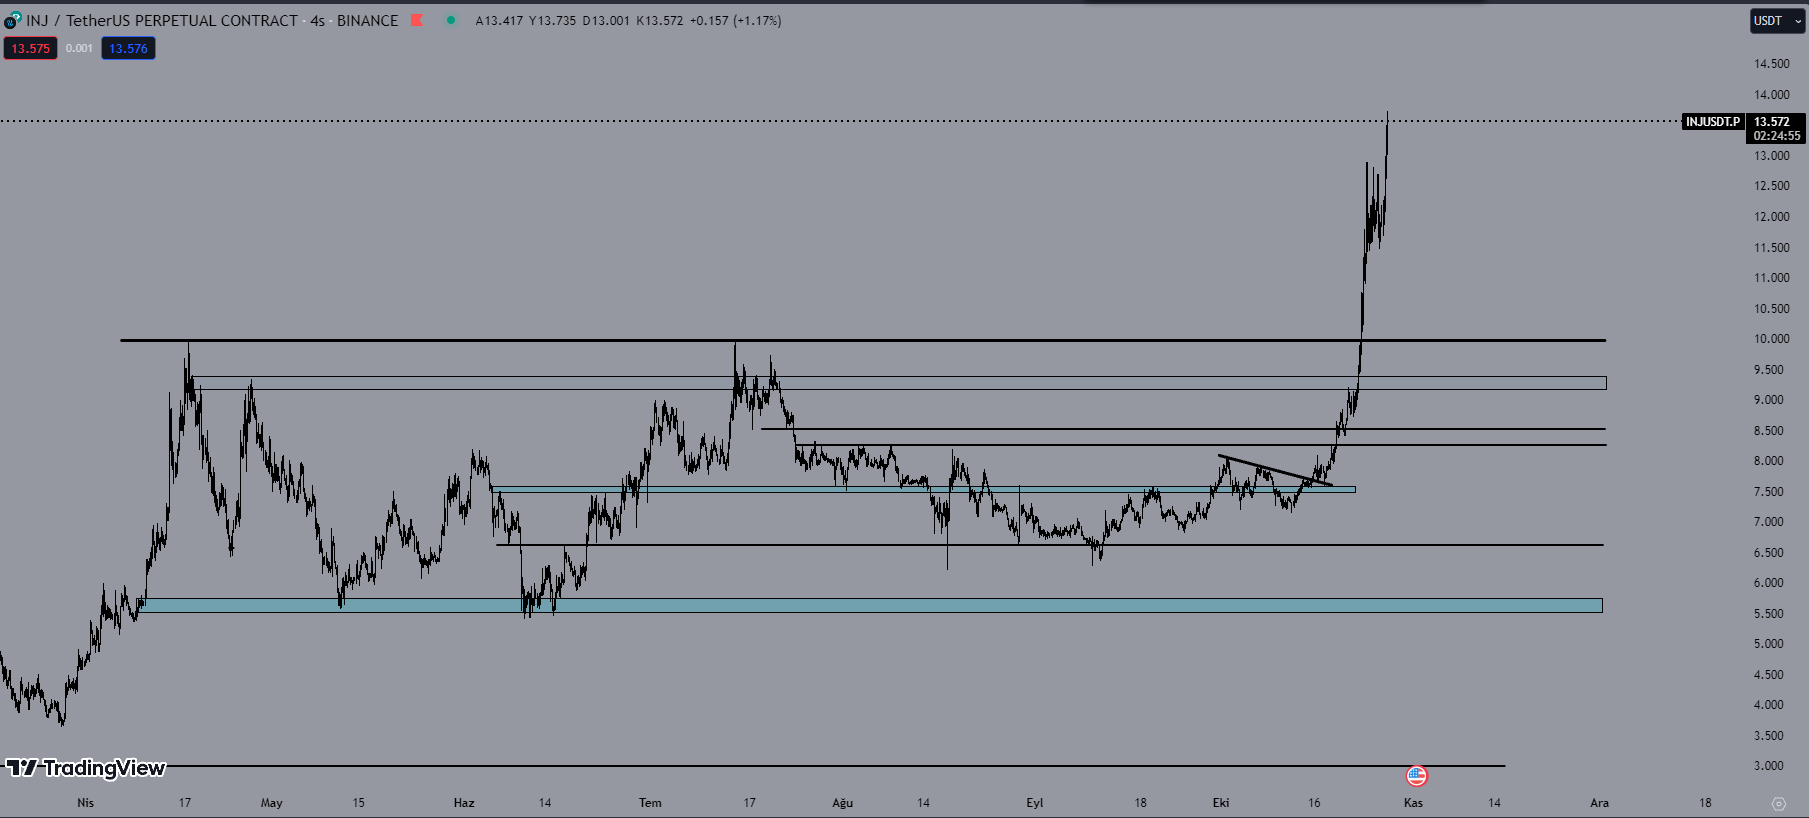
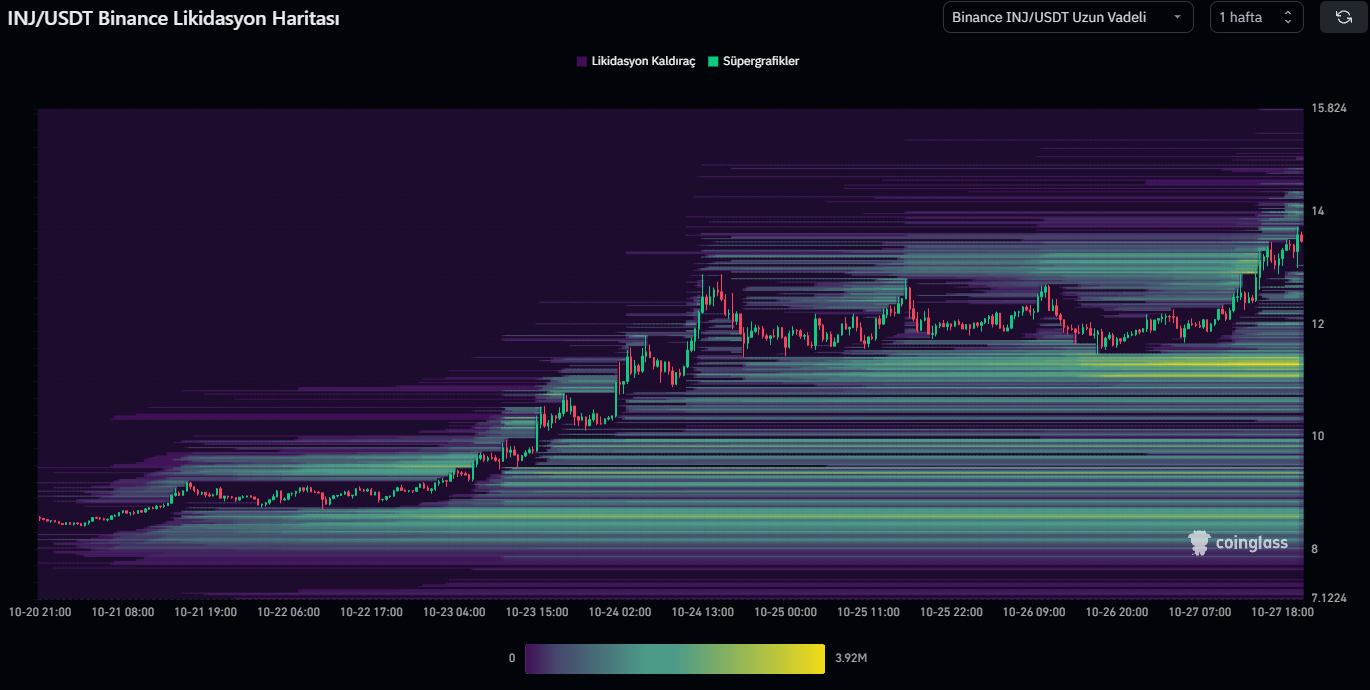
Son dönemlerin en çok yükseliş yaşayan coinlerinden biri olan INJ düşen trend kırılımı sonrası yaklaşık olarak %80 yükseldi. 14.5$ direnç seviyesine doğru ilerliyor. Bu direncin tek seferde aşılmasını beklemiyorum. Olası geri çekilmelerde 10$ seviyesi olan eski tepenin en güçlü destek seviyesi olduğunu düşünüyorum. Düşük zaman dilimlerinde baktığım zaman ise ilk ara destek seviyemiz 11.2$-10.9$ aralığı.
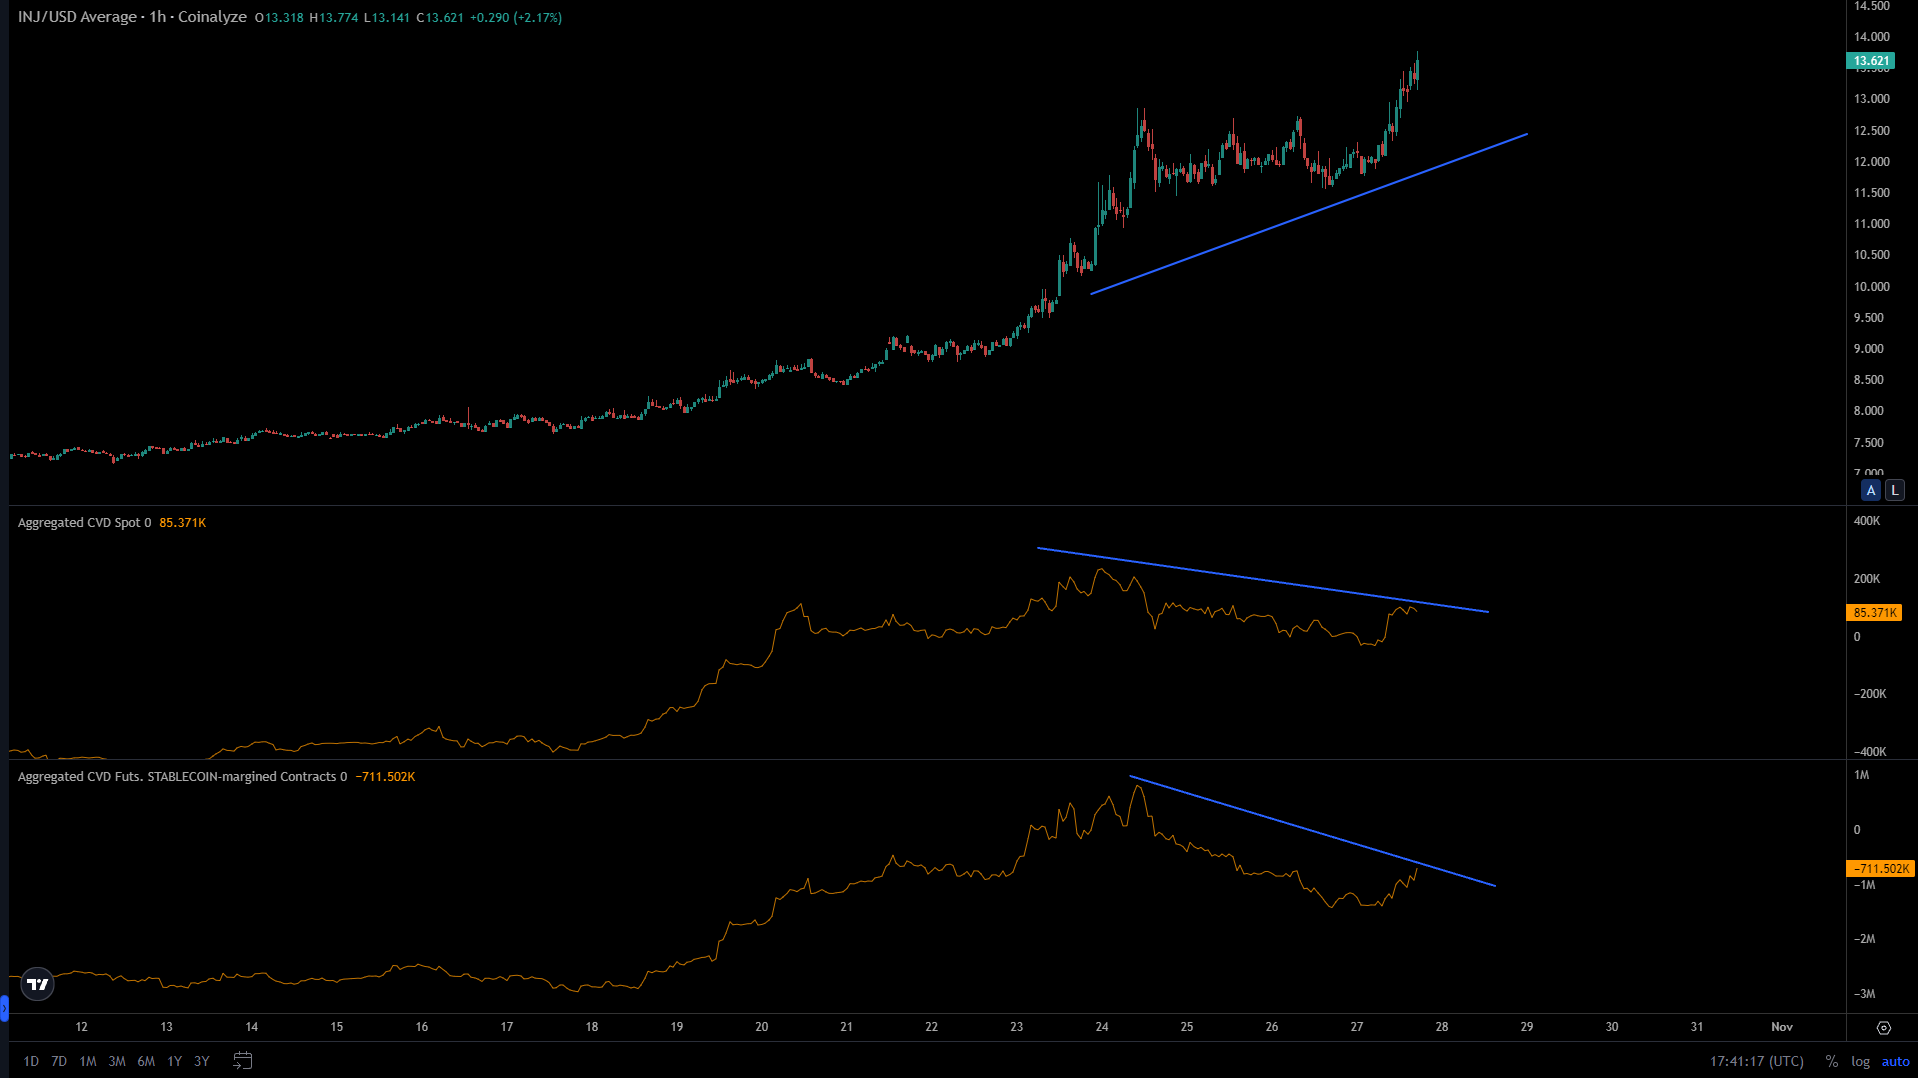
Kaldıraçlı tarafta ve spot tarafında alıcıların iştahının azaldığını görüyoruz. Düzeltme gelmesi durumunda değerlendirmek istediğim coinlerden bir tanesi INJ olacaktır.
FET
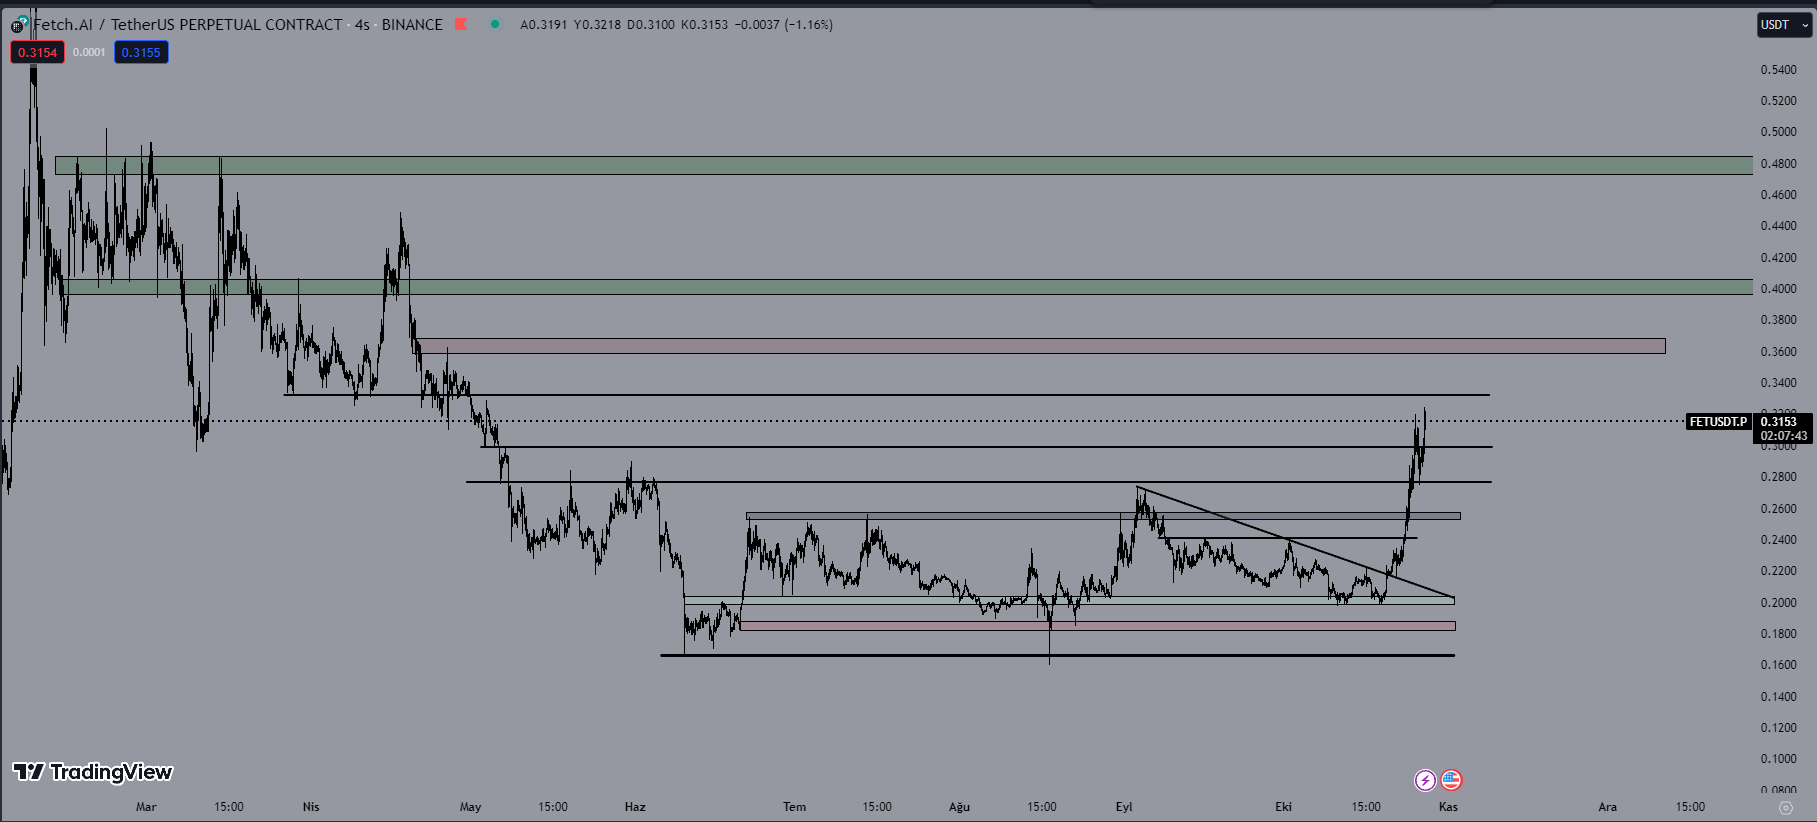
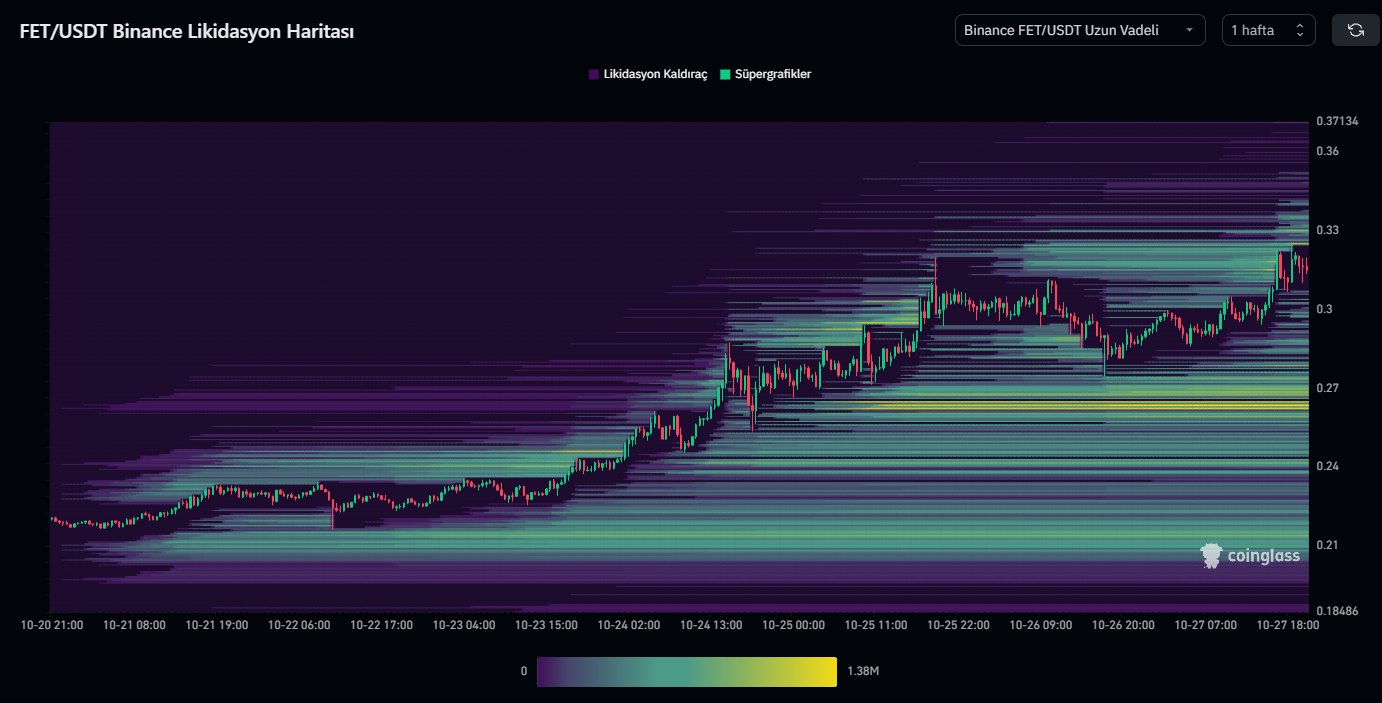
Yapay zeka projeleri arasında en sert yükselen coin FET oldu. Düşen trend kırılımı ile birlikte %50 lik bir yükseliş gerçekleştirdi. Takip ettiğim ilk ara direnç seviyesi 0.3330$ seviyesi. Bu seviyeyi kazanırsa 0.3582$ seviyesini test etmesini beklerim. Yeşil bölgeyle belirttiğim ana direnç seviyesi ise 0.40$ seviyesi. Takip ettiğim ilk destek seviyesi ise 0.30$ ardından 0.2786$ seviyesi ve 0.2550$ seviyesidir.
Burada paylaşılan analizler yatırım tavsiyesi olmamakla beraber, piyasada kısa-orta vade işlem fırsatı verebileceğini düşünülen destek direnç seviyeleridir. İşlem alma ve risk yönetimi sorumluluğu kullanıcının kendisine aittir. Paylaşılan işlemlerde stop loss kullanmanız şiddetle tavsiye edilir.