


Son iki haftadır Kripto Market Nasdaq ve Sp500 ile ayrıştığını izledik.
BTC’nin yükselmesiyle birlikte short pozisyonlarında artış görmekteyiz.
Her ne kadar bu verilere göre işlem almasakta, alacağımız long ya da short yönlü işlemlerde marketin genel durumuna ve Usdt.d’ın o an ki bölgesine bir göz atmakta fayda var.
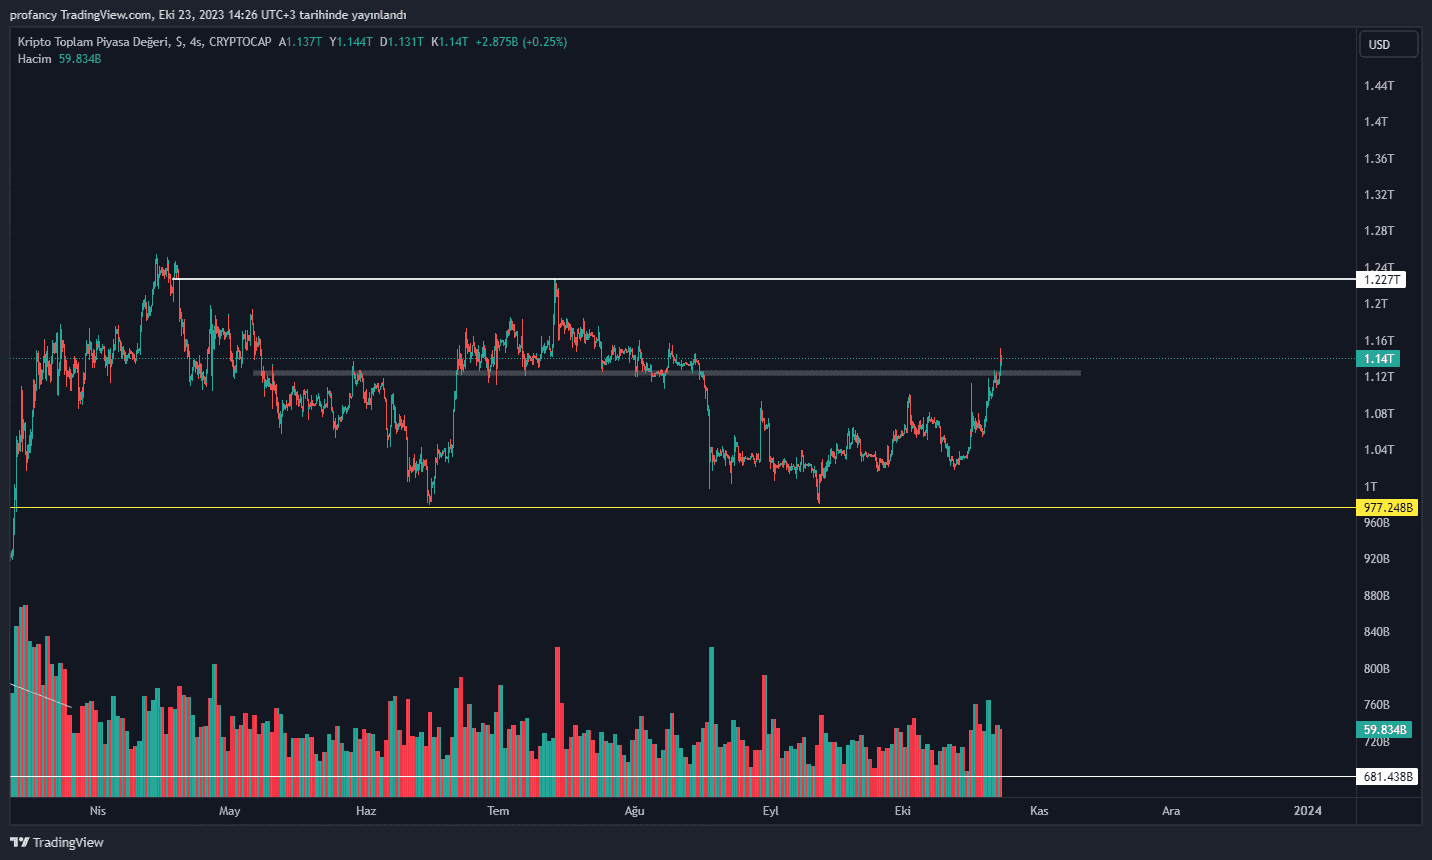
1.128T seviyesi Total market değer için direnç olarak karşısına çıkmıştı fakat en son gelen sahte ETF haberiyle birlikte markete dışardan para girişi artmaya devam etti.
Bu gün 1.128T değerinin üzerinde yapacağı günlük kapanış ile birlikte market 1.20T seviyesine doğru hareketine devam etmek isteyecektir.
USDT.D
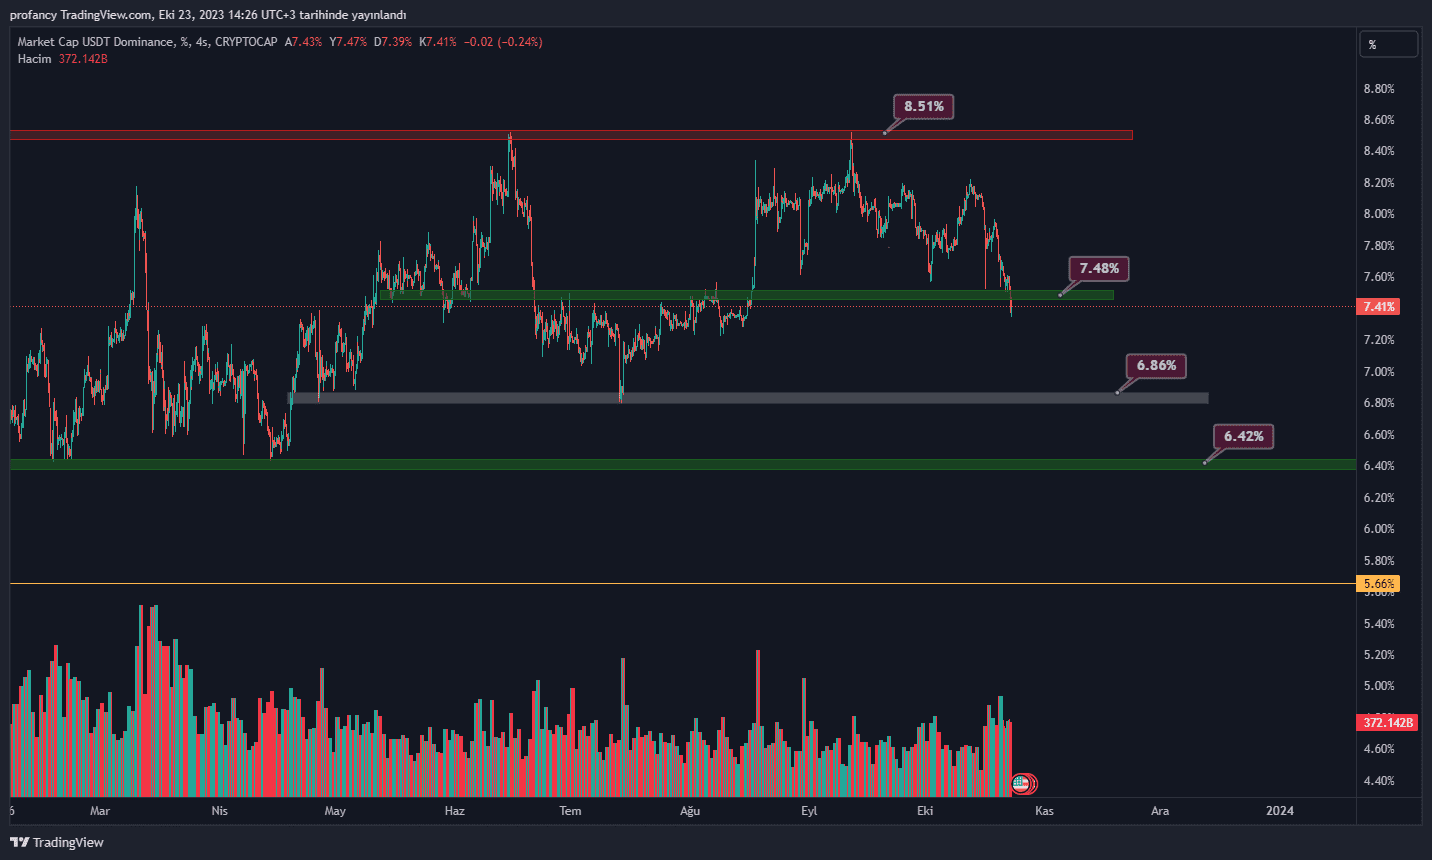
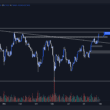
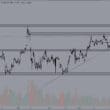
Markette alacağımız işlemlerde bakmamız gereken ve bize yardımcı olan bir diğer grafik olan Tether dominance grafiği %7.50 seviyesi olarak çalışan desteği kırmış altında 4 saatlik mum kapanışı gerçekleşmiş gözükmekte. Market cap grafiğinde gördüğümüz gibi ters korelasyonda çalışan Usdt.d desteği kırmış bir sonraki ara destek seviyesi olan 6.86 bölgesini doğru geri çekilmesi beklenebilir.
Bu da bize short yönlü işlemlerin RİSKLİ olacağı anlamına gelmektedir.
Eğer markette yükselişin devamı gelecek ise USDT.D nin öncelikli olarak %6.86 ve arından %6.42 seviyelerine kadar geri çekilmesi beklenebilir. Bu bölgelerden işlem kapatma ya da kar alınması mantıklı olacaktır.