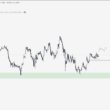


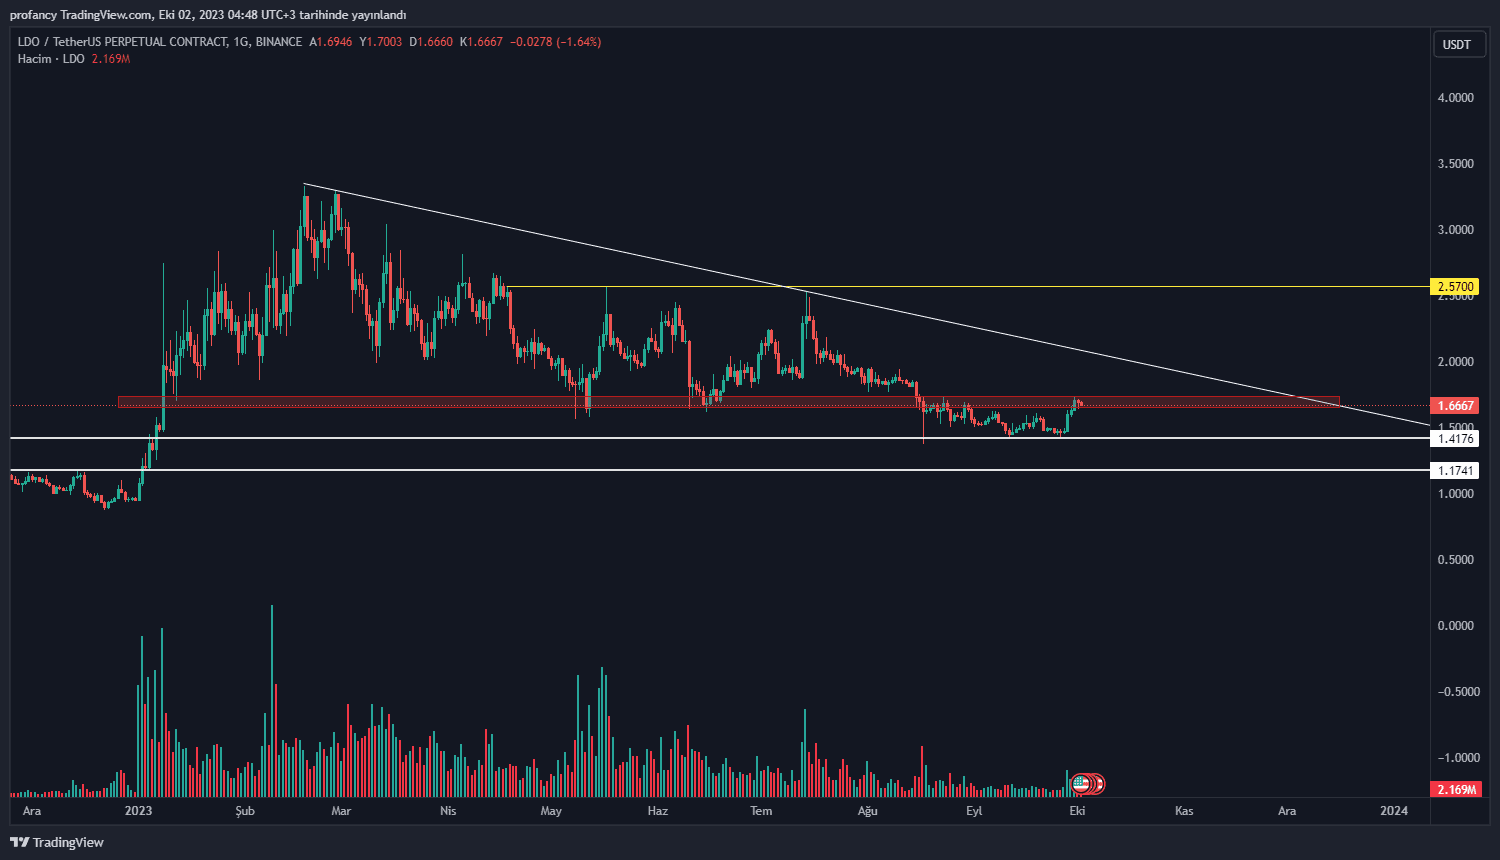
Günlük chartta da görüldüğü gibi zorlu bir direnç bölgesinde olan LDO tarafında henüz kırılım gelmedi.
$1.64-$1.60 seviyeleri kırmış olduğu W formasyonun retest seviyesi olsa da market ile birlikte hareket edeceği için bu bölgeden tepki alacak ya da retest verecek diyemeyiz.
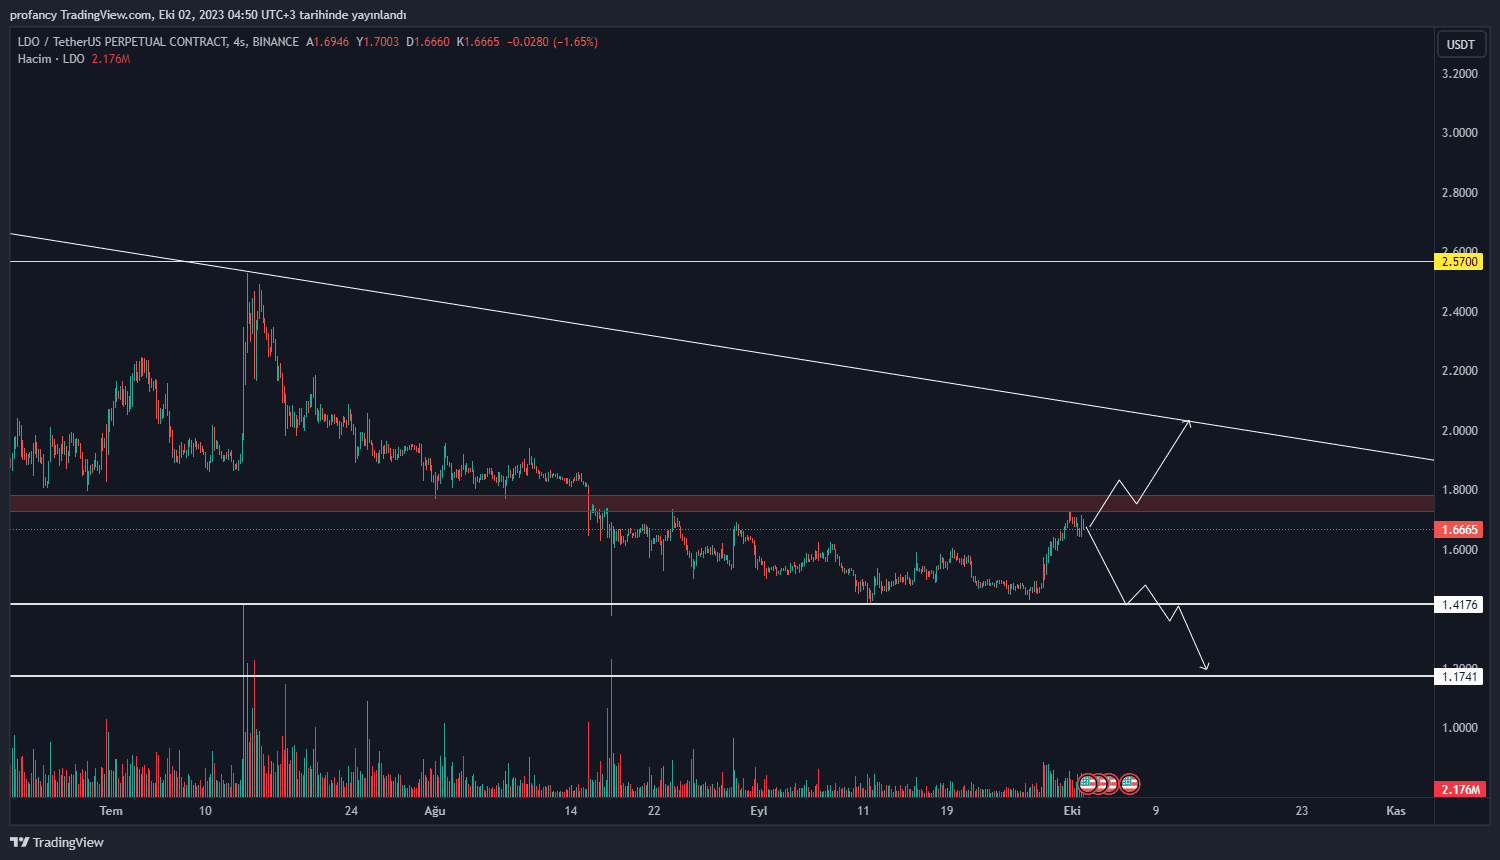
Direnci aşamayıp geri çekilmeye gittiği durumda LDO ilk destek olarak karşısına çıkacak olan bölge $1.41 seviyesi olarak gözükmekte. Buranın altında yapacağı 4h kapanış ile beraber bir alt bölge olan $1.18 seviyelerine kadar geri çekilme görebilmemiz muhtemel.
Long yönlü işlem için direnç kırılımını bekleyerek son yakın tarih tepesi olan $1.74 seviyelerinden giriş yapılabilir. Hedef olarak hem yatay hem de düşen trend olarak karşımıza çıkabilecek olan $1.95 bölgesi takip edilebilir.
Burada paylaşılan analizler yatırım tavsiyesi olmamakla beraber, piyasada kısa-orta vade işlem fırsatı verebileceğini düşünülen destek direnç seviyeleridir. İşlem alma ve risk yönetimi sorumluluğu kullanıcının kendisine aittir. Paylaşılan işlemlerde stop loss kullanmanız şiddetle tavsiye edilir.