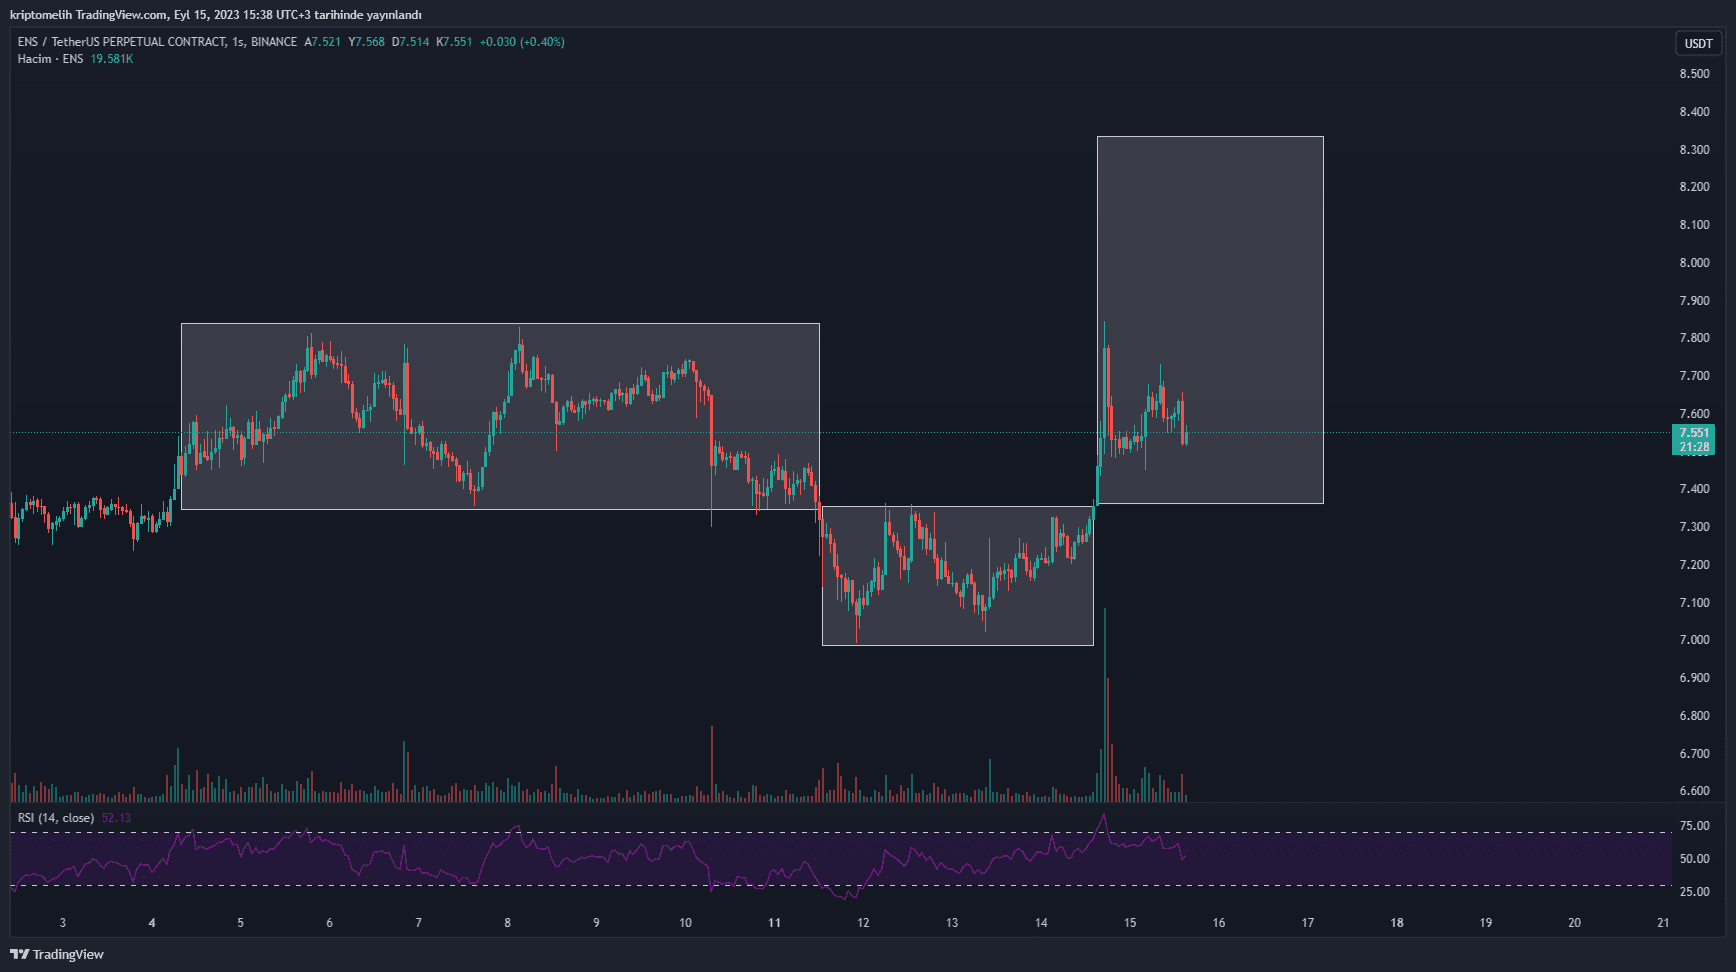


ENS, yatayda önemli bir destek seviyesi haline gelen 7.344$ bölgesini korumayı başarmıştır. Bu bölgeyi daha yakından incelediğimizde, fiyatın 6.72$’a atmış olduğu fitil ile beraber destek bölgesinin altına sarkmış olsa da, günlük kapanışı tekrar destek üzerinde yapmıştır. Son fiyat hareketinde likidite alan bölgeyi hedeflemeyerek 7.08$ bölgesinden tepki alması ve 7.344$ desteğini korumasının, bullish bir emare olduğunu düşünüyorum.

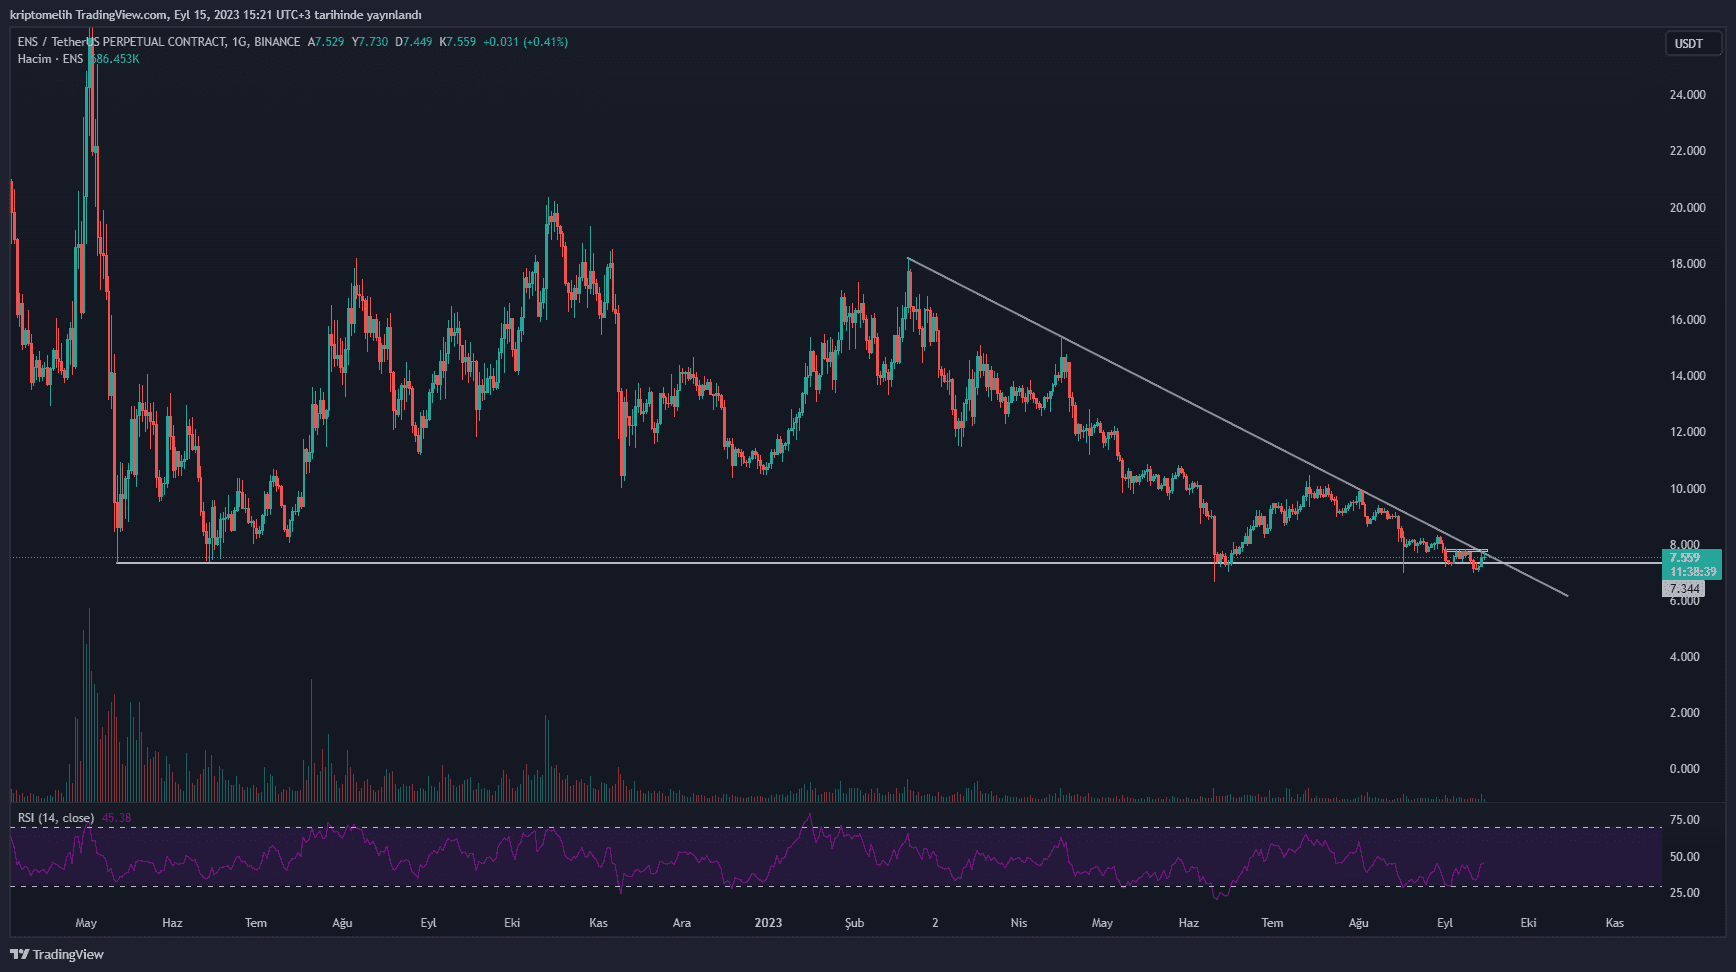
Şubat ayından itibaren oluşturmuş olduğu düşen trend yapısını, dün markette yaşanan yükseliş ile beraber trendin üzerine fitil atmış olsa da, fiyatın tepki aldığı ve grafikte gri kutu ile belirttiğim 7.77$-7.84$ direncinin, yükselişin kalıcı olması ve devamı açısından kazanılması önemli bir bölge olduğunu düşünüyorum. ENS için takip ettiğim ve belirttiğim bu direncin kazanılması durumunda, 8.80$ direncine kadar bir yükseliş gerçekleştirmesini ve grafiğin sol tarafında belirtmeye çalıştığım short likiditelerini temizlemek isteyeceğini düşünüyorum.
Ek bir bakış açısı olması adına, aynı zamanda Power of Three (Po3) formasyonu bulunmaktadır. Bu formasyonun hedefi ise 8.33$ seviyesine gelmektedir.