


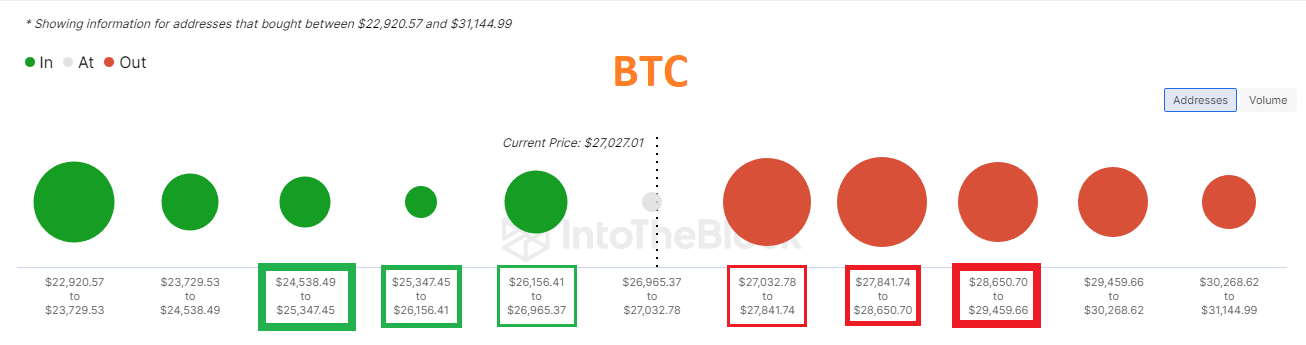
Onchain üzerinde $27032-$29459 maliyetli kullanıcılar yüksek zararda görünüyor. Kırmızı küreler ne kadar büyük , yeşil küreler ne kadar küçük ise yükseliş ihtimali o kadar yükselir. Yeşil küreler ne kadar büyük, kırmızılar küreler ne kadar küçük ise düşüş ihtimali o kadar yükselir. Kürelerin bulunduğu seviye aralıkları güçlü destek ya da güçlü direnç olarak çalışabilir.
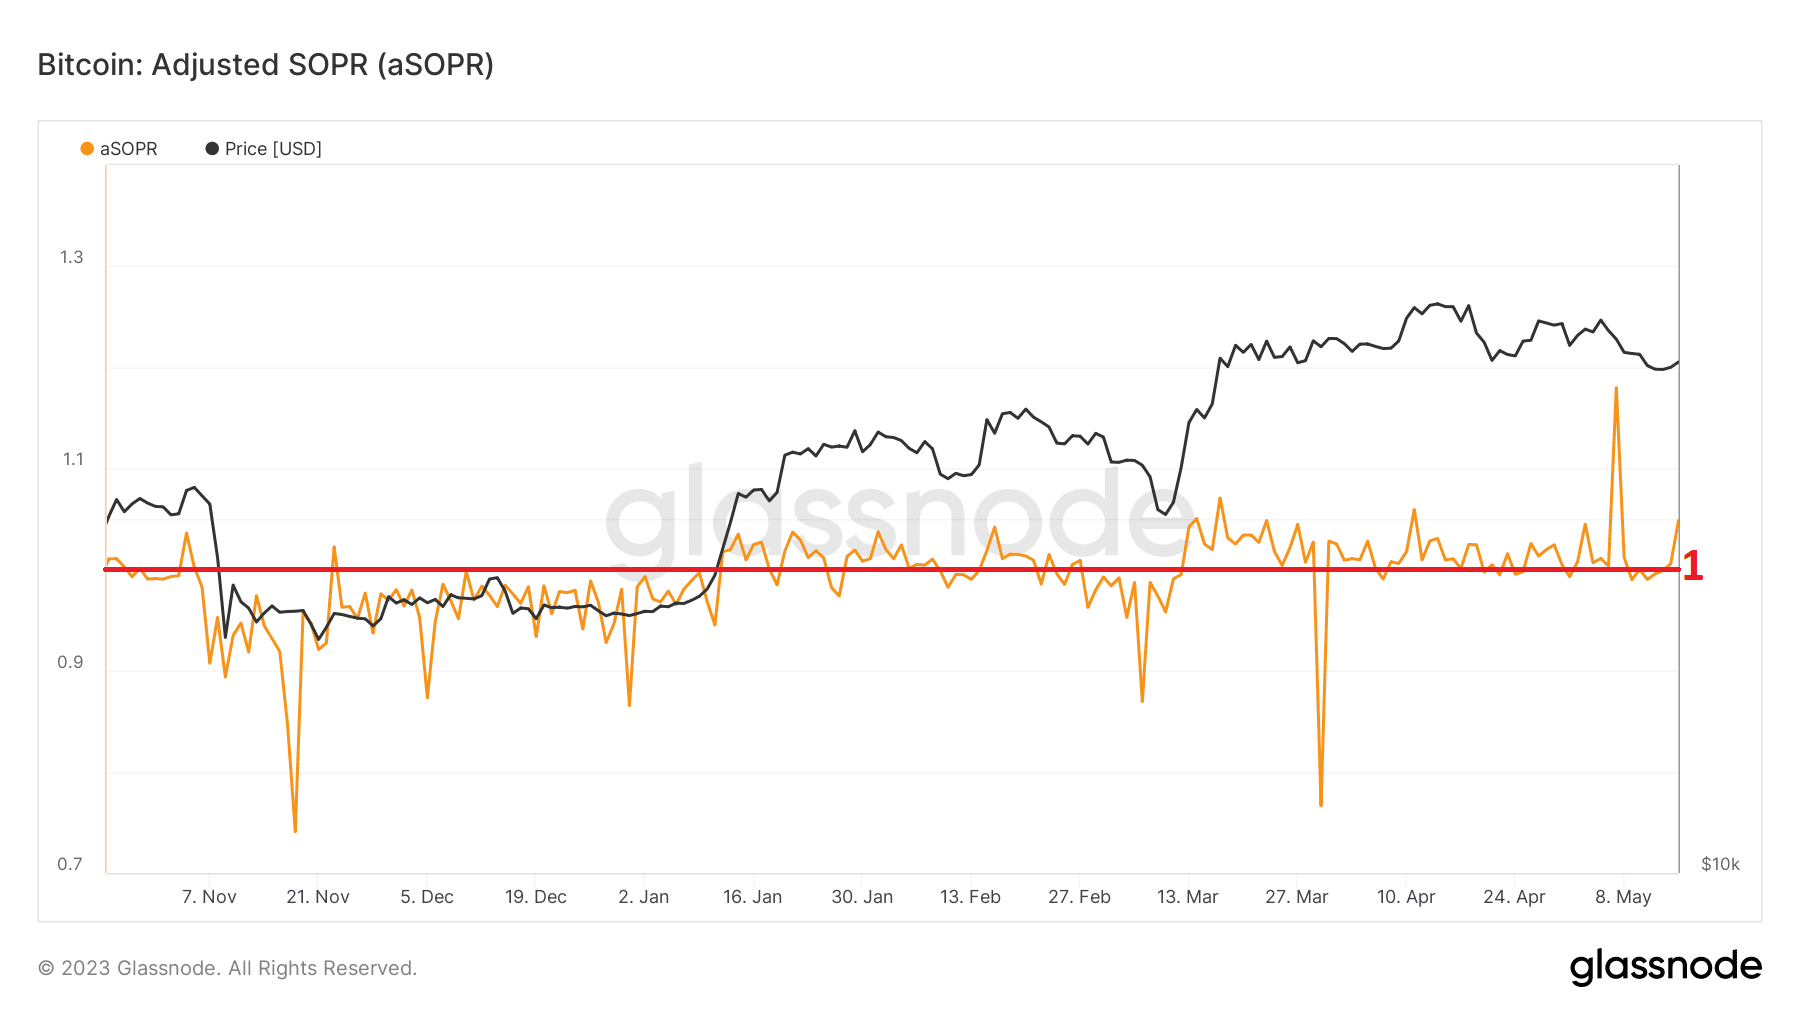
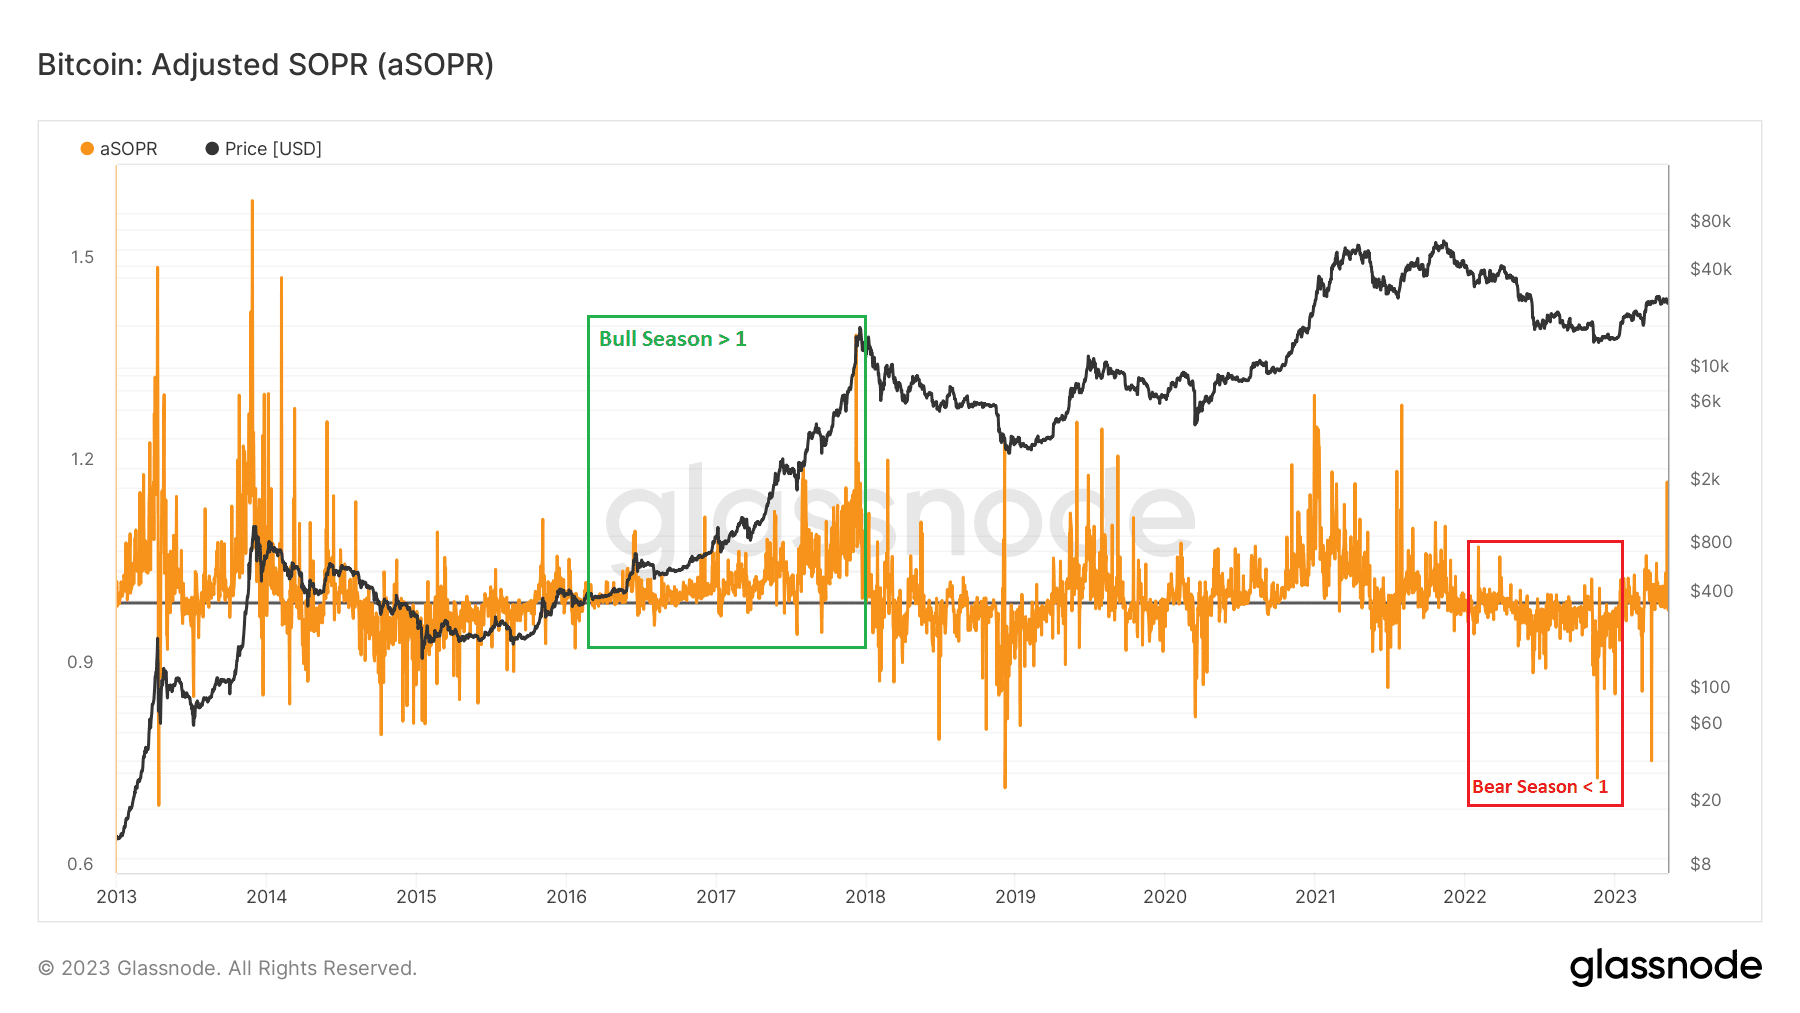
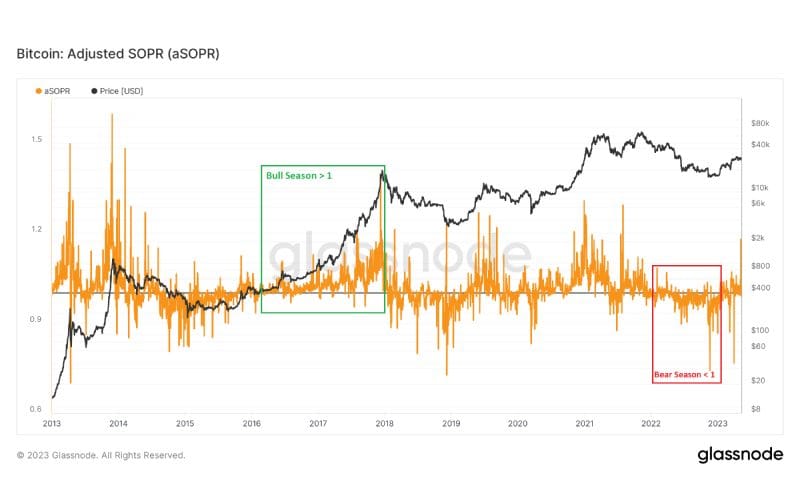
ASOPR verisi boğa sezonlarında çoğunlukla 1 seviyesi ve üzerinde, ayı sezonunda 1 seviyesi ve altında performans göstermiş. Bitcoin boğa sezonunda ise bu verinin 1 seviyesinden yukarıda tutunması gerekir.
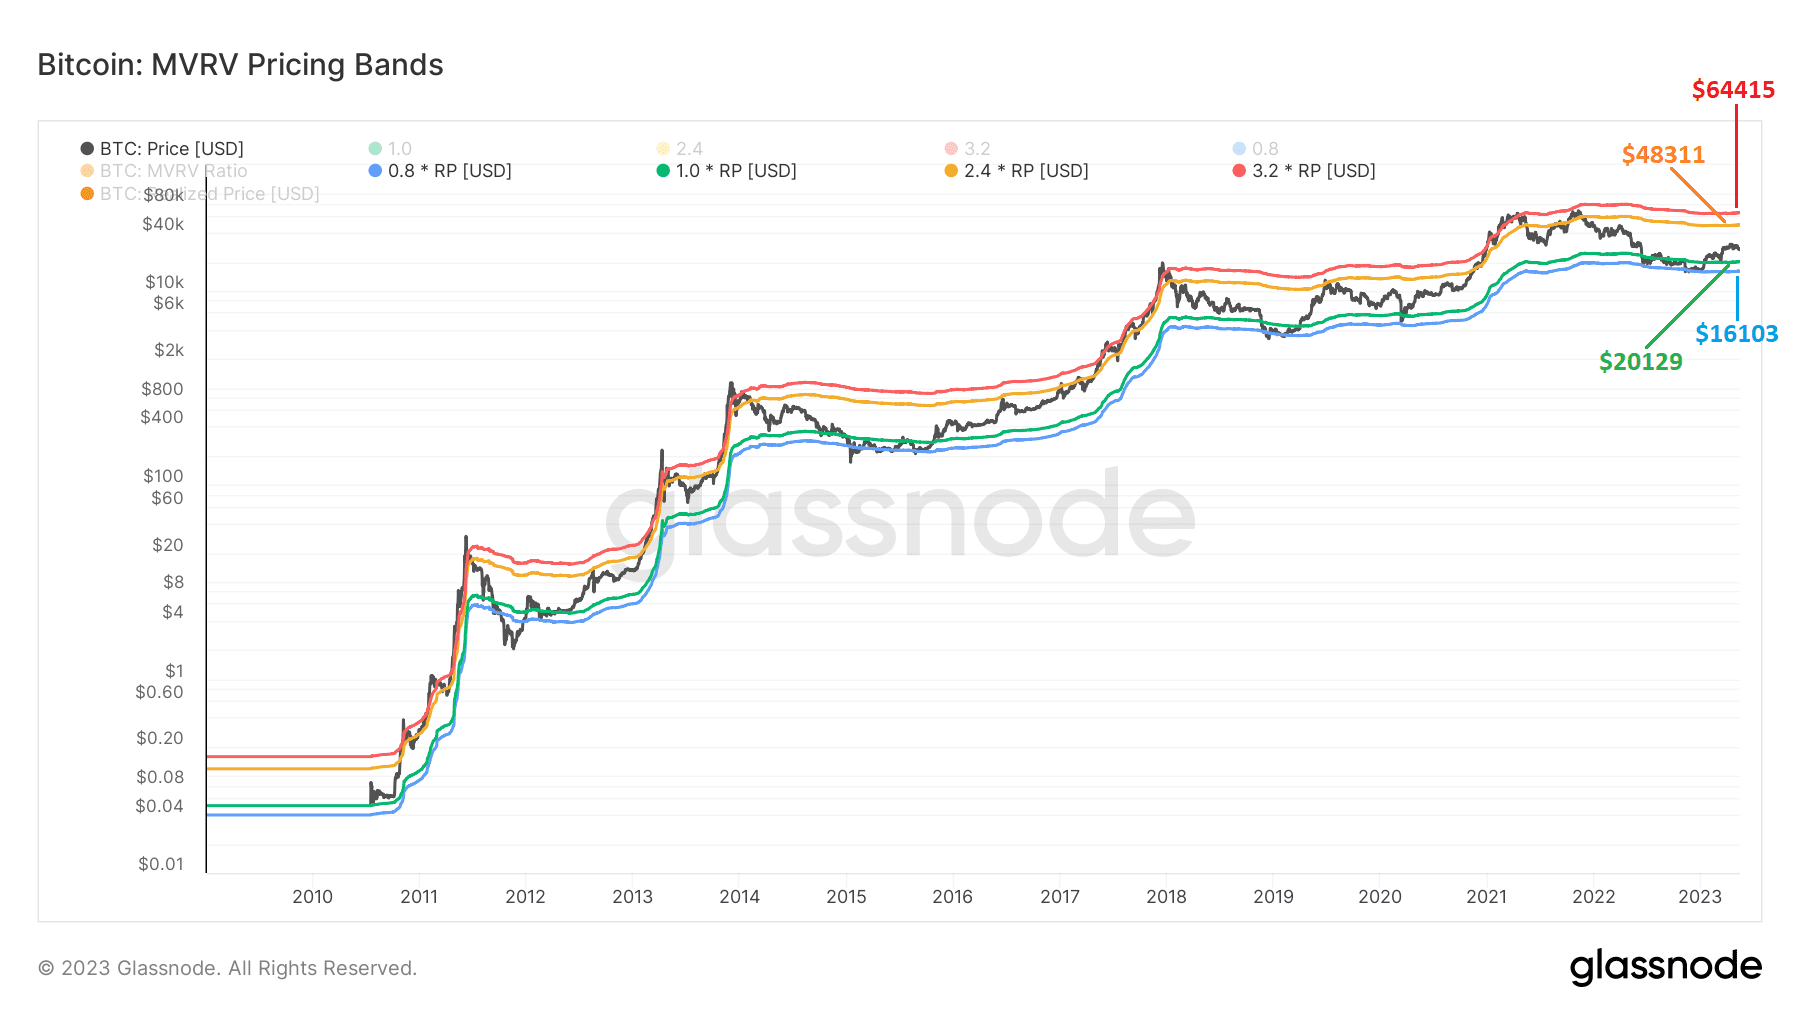
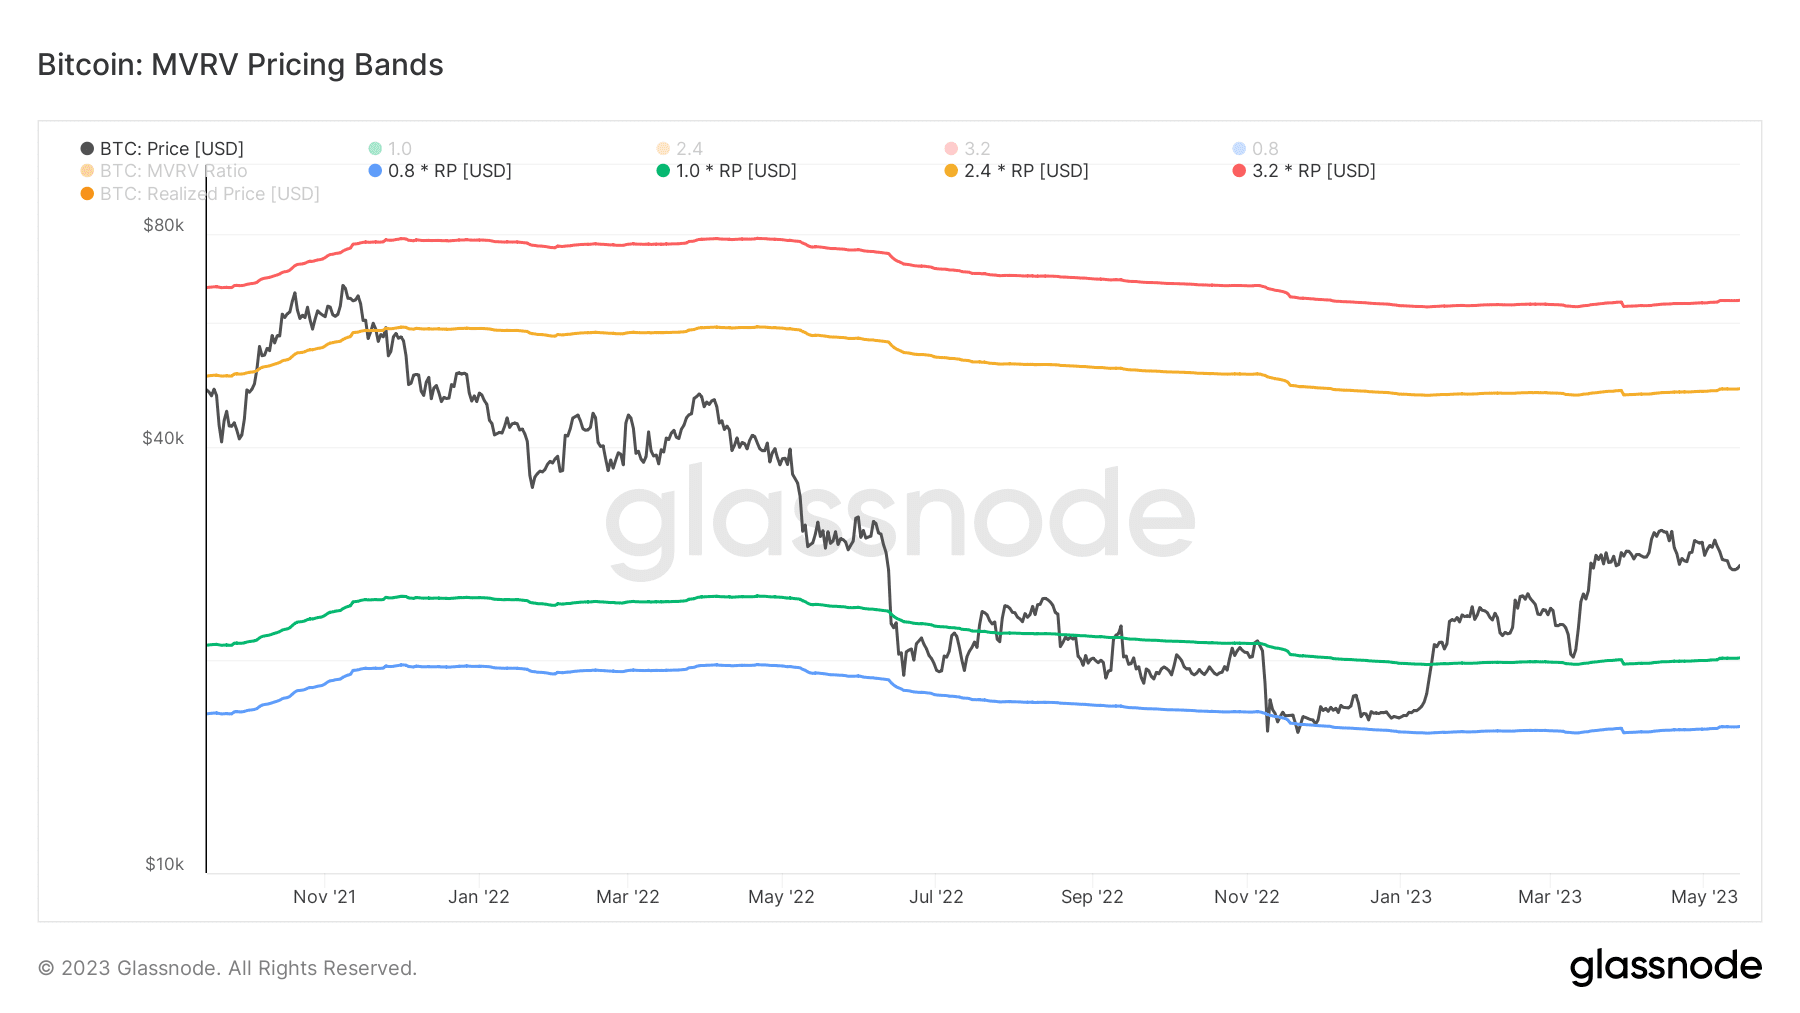
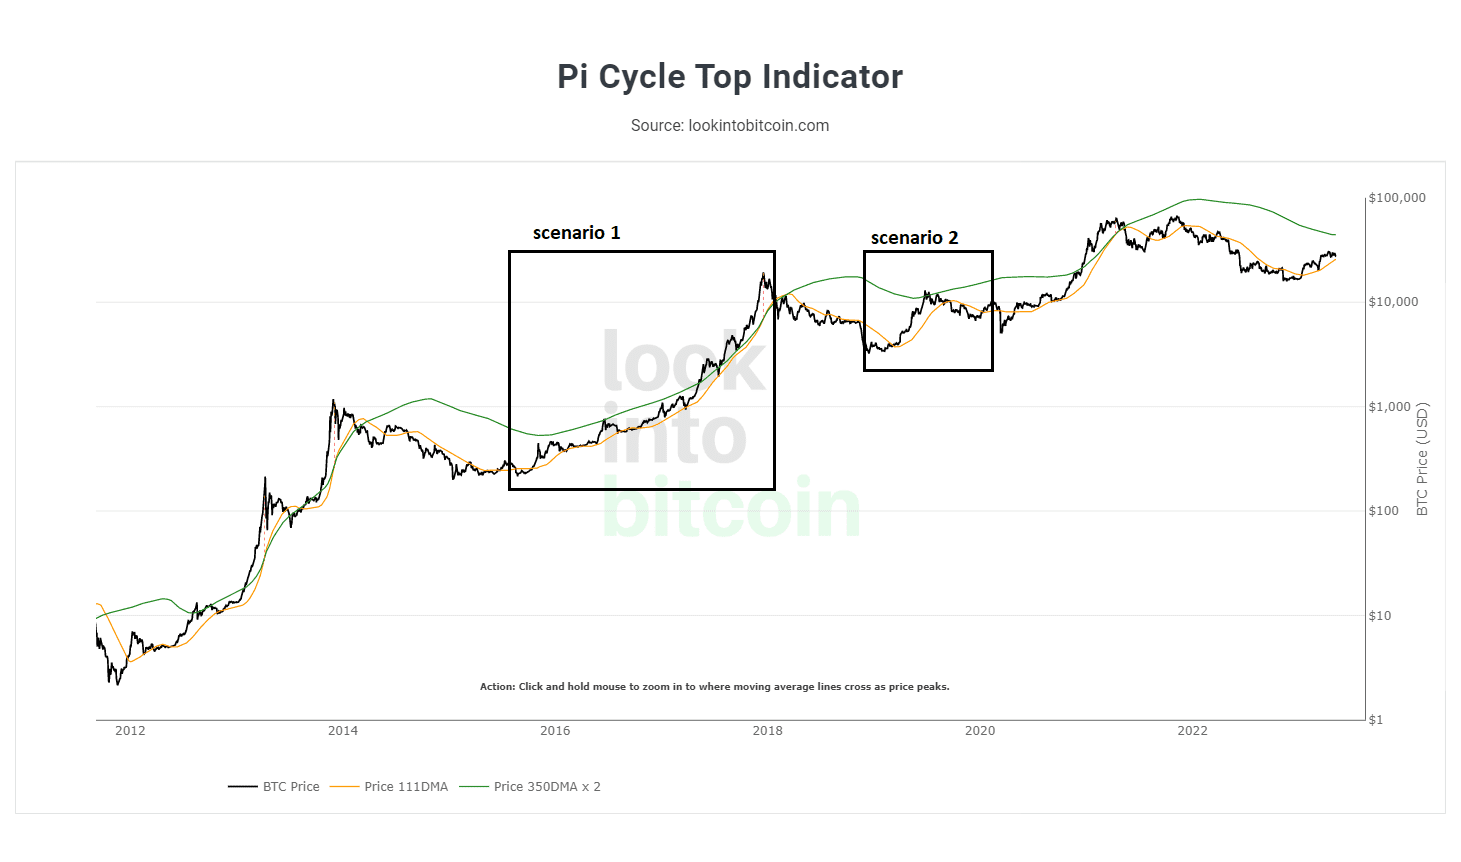
Bitcoin, geçmişte yeşil ve mavi bantlar arasındaki hareketinden sonra yükseliş yaşamış ve ardından turuncu banda kadar yükseliş göstermiş. Kesinlik yok ancak şu anki fiyat hareketi de aynı şekilde olursa bugünkü turuncu direnç $48311. Yeşil destek bandı fiyatı $20129.
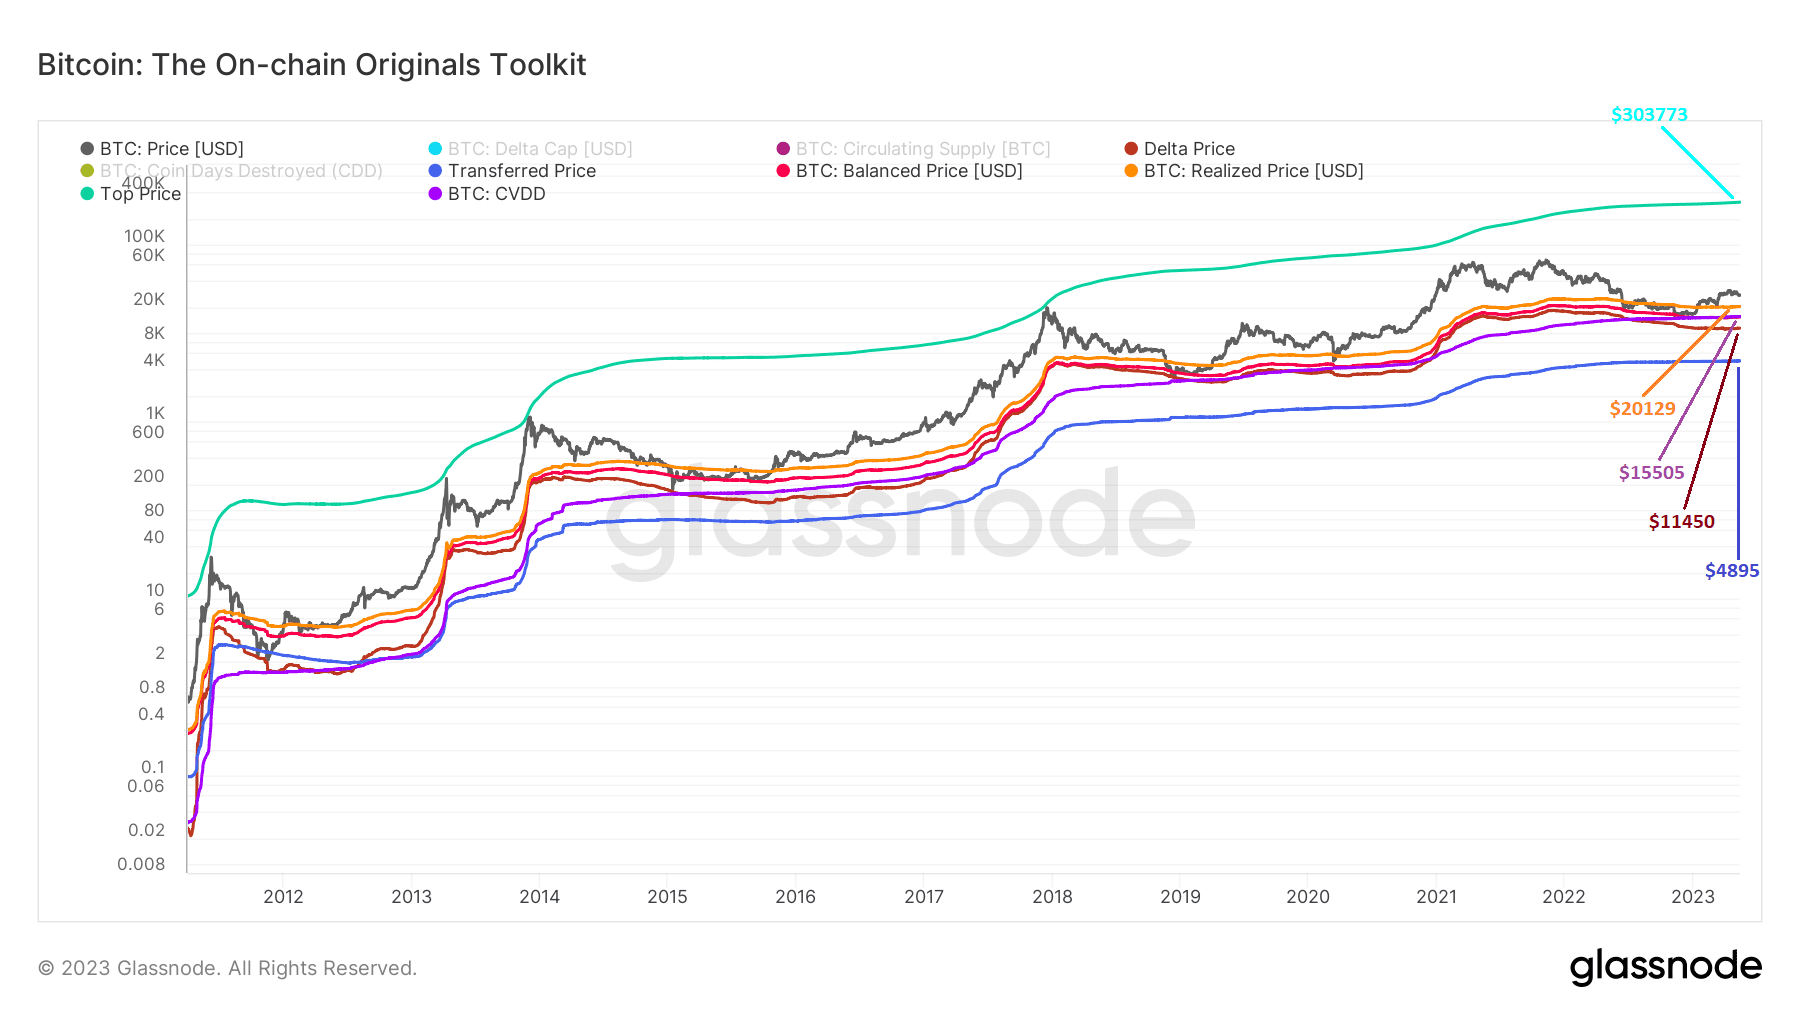
Bu grafikteki veriye göre Bitcoin, bordo ve mor bantlarda tutunduktan sonra turuncuya ilerlemiş. Turuncu bant üstünde tutundukça boğa sezonu yaşanmış ve turkuaz banda ilerleme görülmüş.
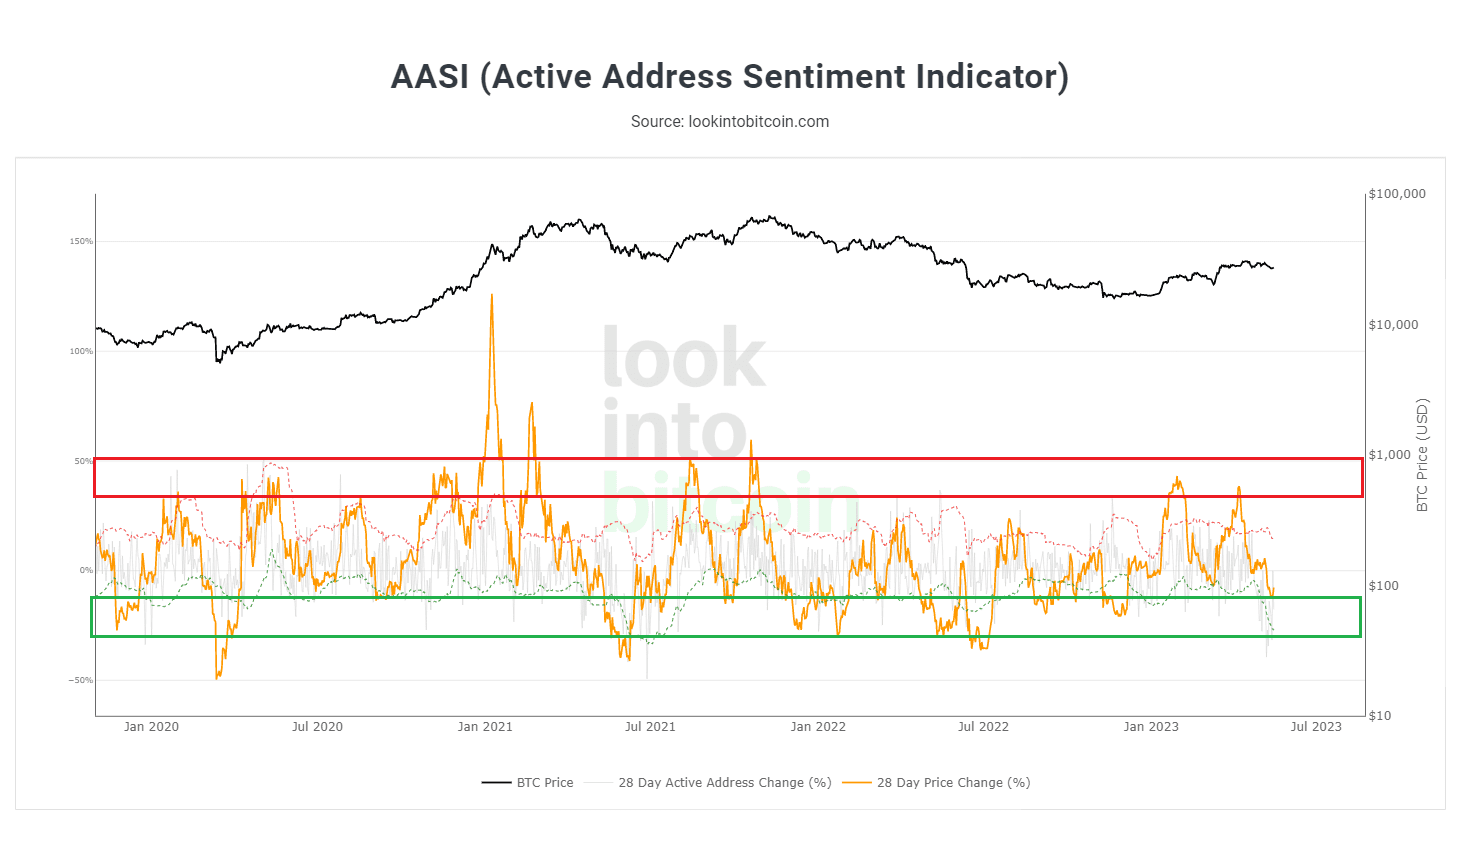
The Active Address Sentiment Indicator verisi, ana destek bölgesinden tepki almış görünüyor ancak çok güçlü değil. İlerleyen zamanlarda yeşil destek bandına ilerleyecek mi izliyor olacağız. Hiçbir veri tek başına yeterli değildir ancak alım için bu veri ile birlikte güçlü fiyat destek bölgeleri takip edilebilir.
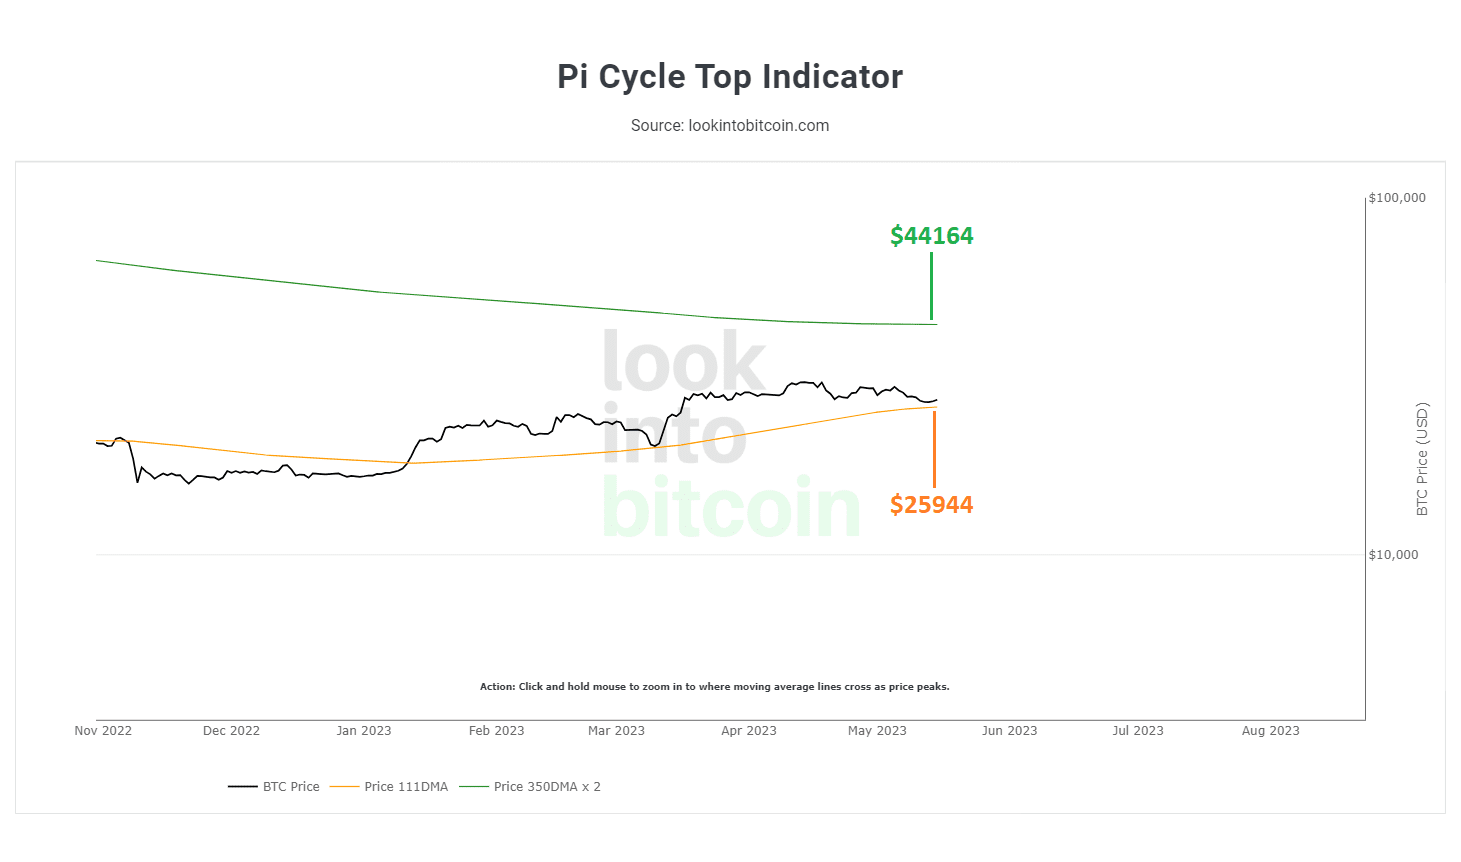
Pi Cycle Top Indicator verisine göre, $25700-$25800 (turuncu banttan) bölgesinden bitcoin güçlü bir tepki aldı. Turuncu bant altı günlük ya da haftalık kapanışlarda düşüş derinleşebilir. Takip ediyor olacağız.
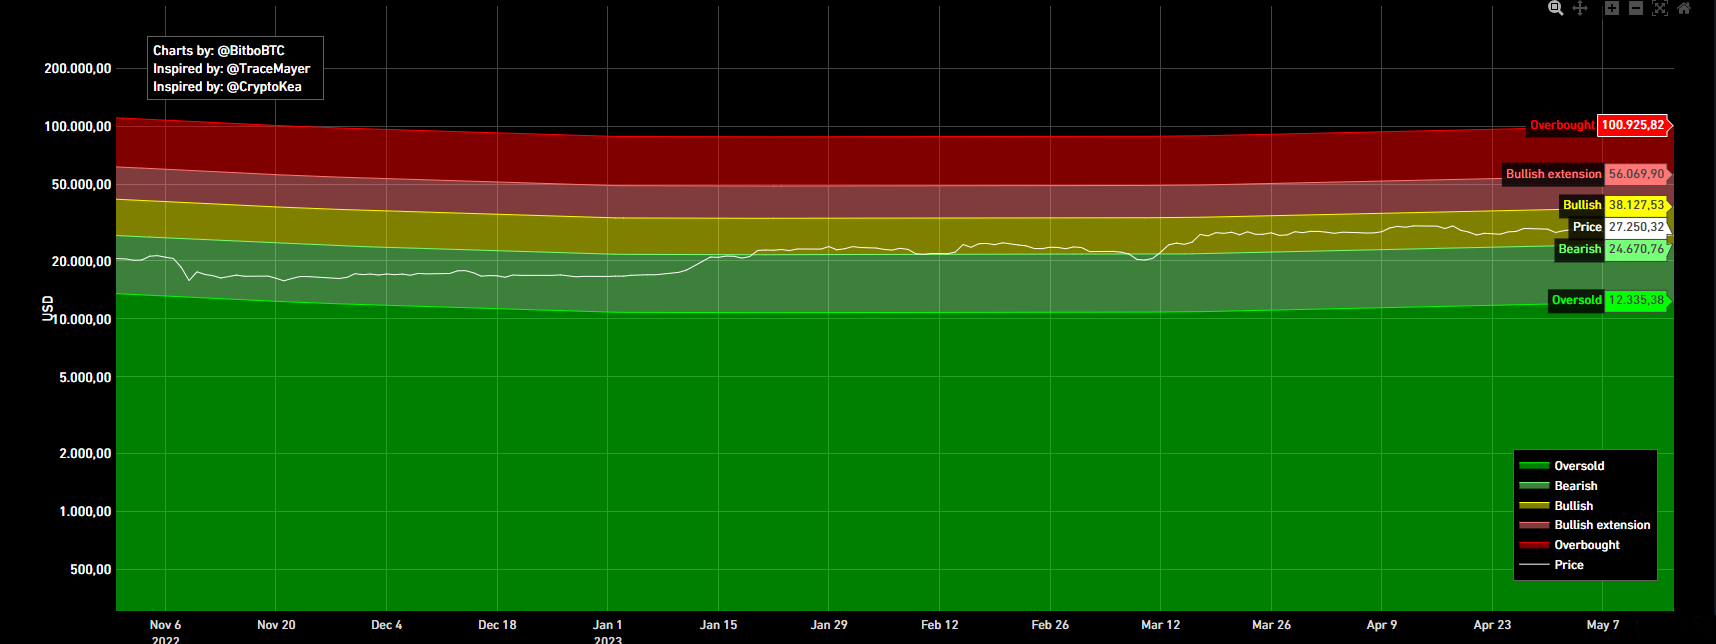
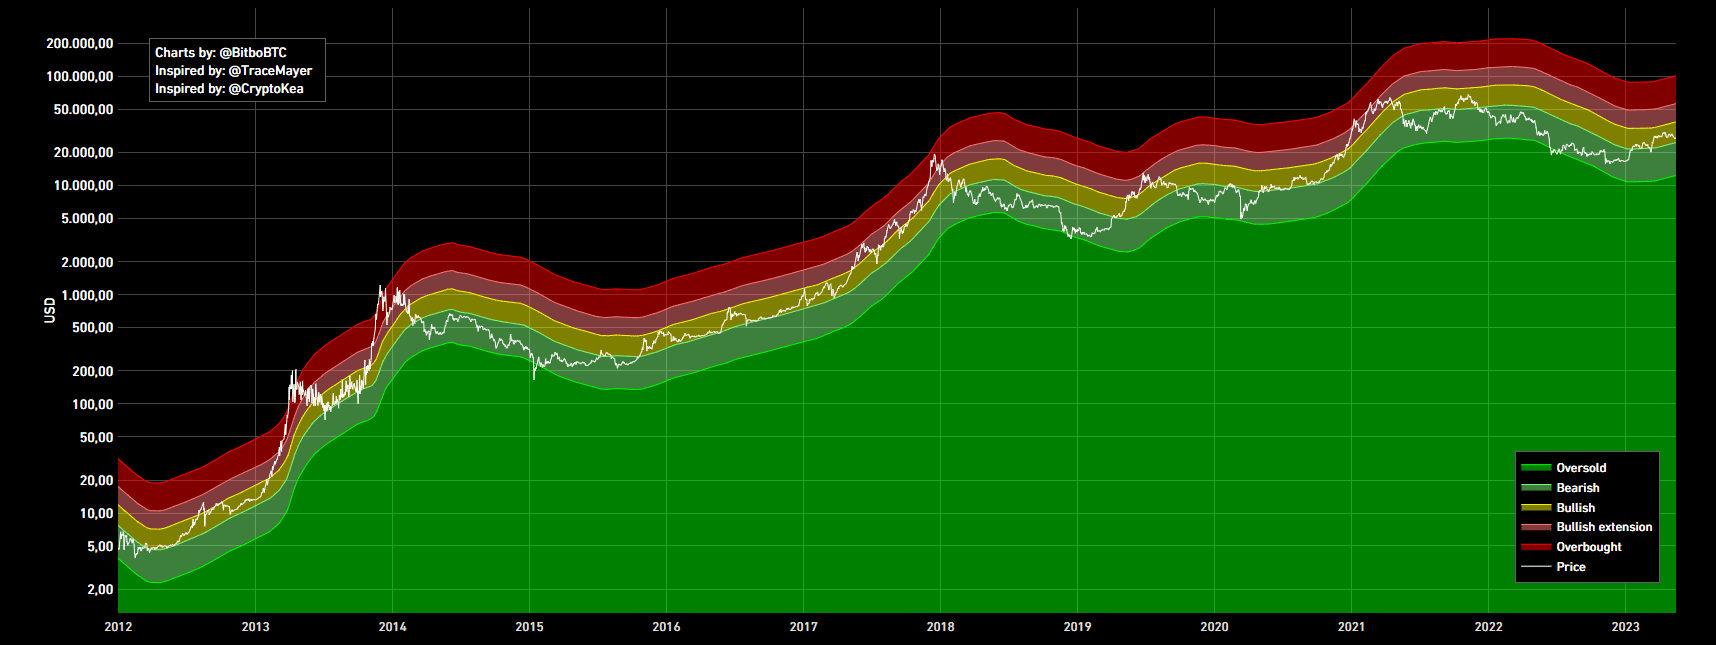
Bitcoinin bullish yapısını koruması için tutunması gereken seviye $24670. Daha da sert yükselişler yapabilmesi için $38127seviyesini aşması beklenir. Tekrar derin bir ayı sezonu yaşanması durumunda izleyeceğimiz destek seviyesi $12335.
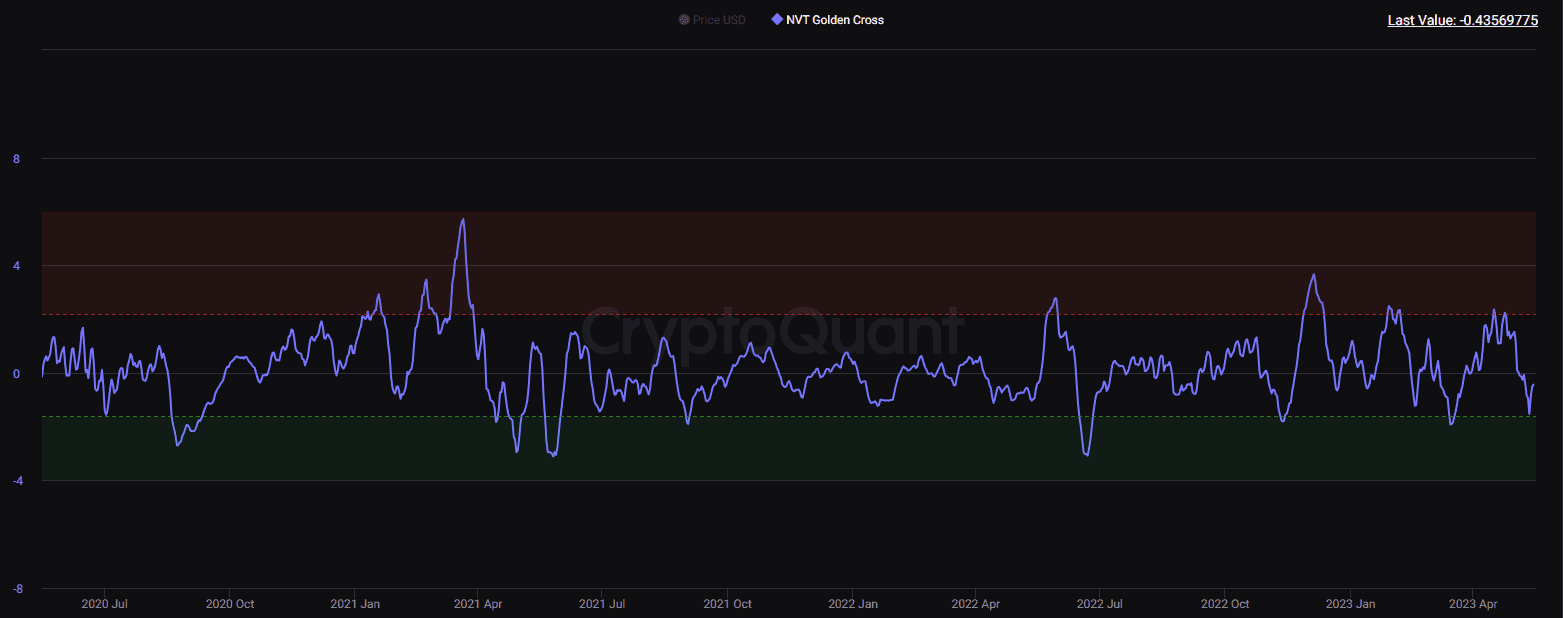
NVT Golden Cross verisi, Nisan sonundaki seviyelerinden düşüş yaşayarak ana destek bölgesine gelmiş ve oradan yukarı yönlü tepki almış görünüyor. Buradaki kalıcılığına bağlı olarak alım yapmak için takip edilebilir bir veri.
Onchain verileri ve açıklamalarına buradan göz atabilirsiniz.
Onchain analiz, blockchain piyasalarından elde edilen verilerden oluşur ve sadece borsalara giriş ve çıkışları yansıtır. Bu veriler olumlu veya olumsuz şekilde yorumlanabilir, ancak boğa veya ayı piyasasıyla ilgili kesin bir öngörü içermez. Yukarıda paylaşılan tüm analizler eğitim amaçlıdır, bu gönderi herhangi bir finansal tavsiye içermez.