


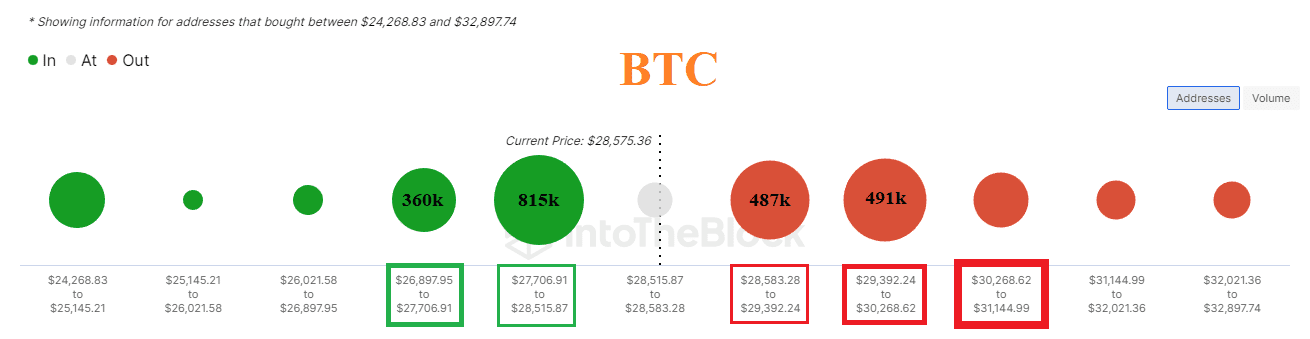
Onchain üzerinde $26900-$28515 aralığından bitcoin alan kullanıcılar yüksek karlılıkta görünüyor. $28600-$30270 maliyetli kullanıcılar ise zararda görünüyor. Kırmızı küreler ne kadar büyük , yeşil küreler ne kadar küçük ise yükseliş ihtimali o kadar yükselir. Yeşil küreler ne kadar büyük, kırmızılar küreler ne kadar küçük ise düşüş ihtimali o kadar yükselir. Kürelerin bulunduğu seviye aralıkları güçlü destek ya da güçlü direnç olarak çalışabilir.
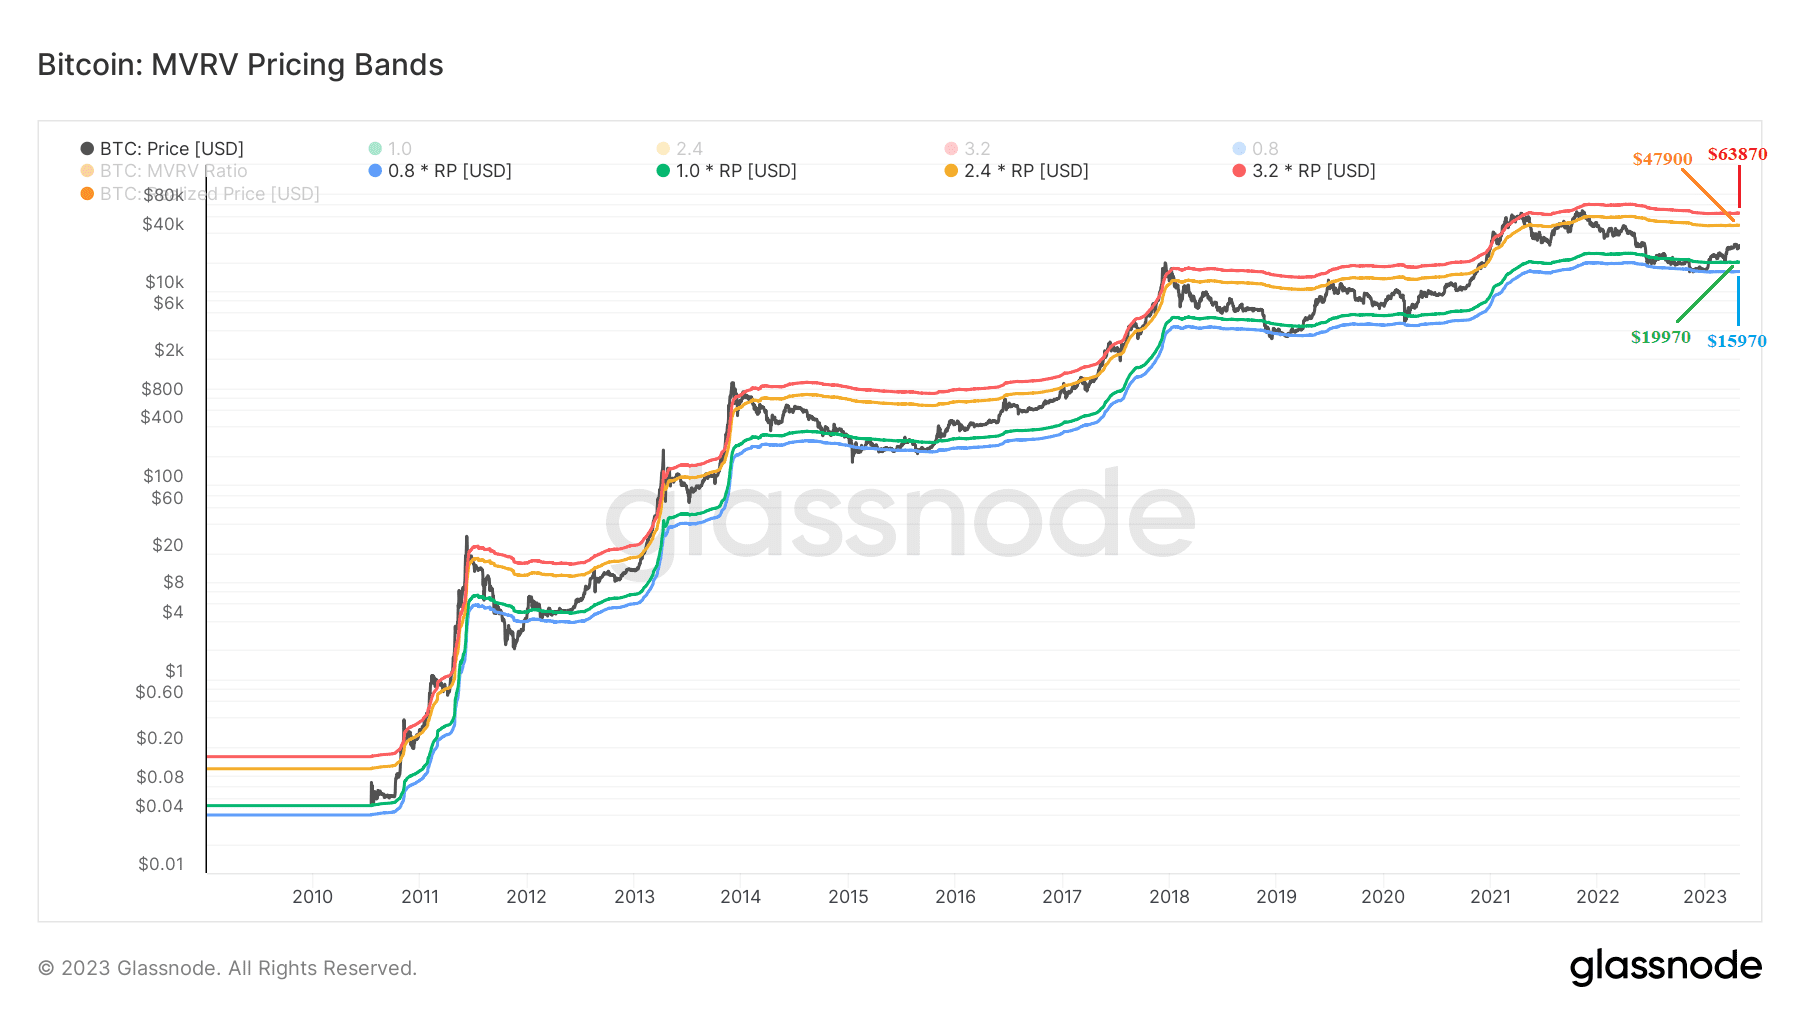
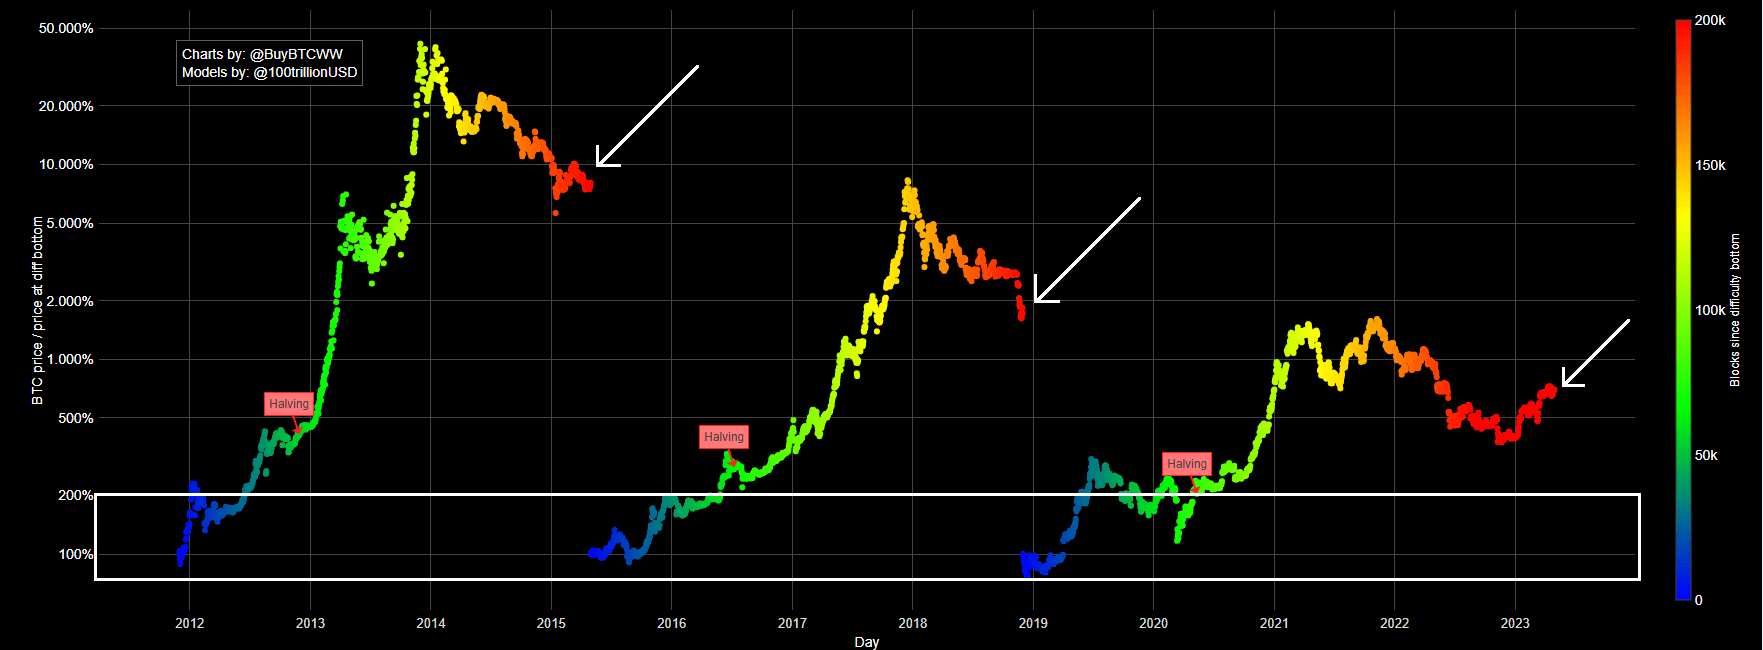
Bitcoin, geçmişte yeşil ve mavi bantlar arasındaki hareketinden sonra yükseliş yaşamış ve ardından turuncu banda kadar yükseliş göstermiş. Kesinlik yok ancak şu anki fiyat hareketi de aynı şekilde olursa bugünkü turuncu direnç $47900. Yeşil destek bandı fiyatı $19970.
Bitcoin’de, madenciler için karlılık, Bitcoin fiyatının ve madencinin madencilik için elektrik satın alma maliyetinin bir fonksiyonudur. Bazı madenciler boğa piyasasında satmak ve çok daha fazla kar etmek için ya da ayı sezonunda ayakta kalabilmek için ellerinde fazla sayıda Bitcoin tutarlar. Ancak bir düşüş (ayı) senaryosunda, fazla kazanç elde edemeyen ve ellerindeki Bitcoinleri satmak zorunda kalan madenciler, madencilik faaliyetlerini durdurmak zorunda kalırlar. Elinde Bitcoin tutan madenciler, diğer madencileri ağdan çıkmaya zorlamak için ellerindeki Bitcoinleri zararına da olsa satmak isteyebilirler. Ancak bu Bitcoin’de “ölüm sarmalı” denilen olaya yol açabilir. Ölüm sarmalı da fiyatın istikrarlı şekilde sürekli düşüş göstermesidir. Elbet fiyat bir noktada yukarı yönlü dönüş sağlar ancak bu süreçte birçok madenci kazım yapmayı durdurur.
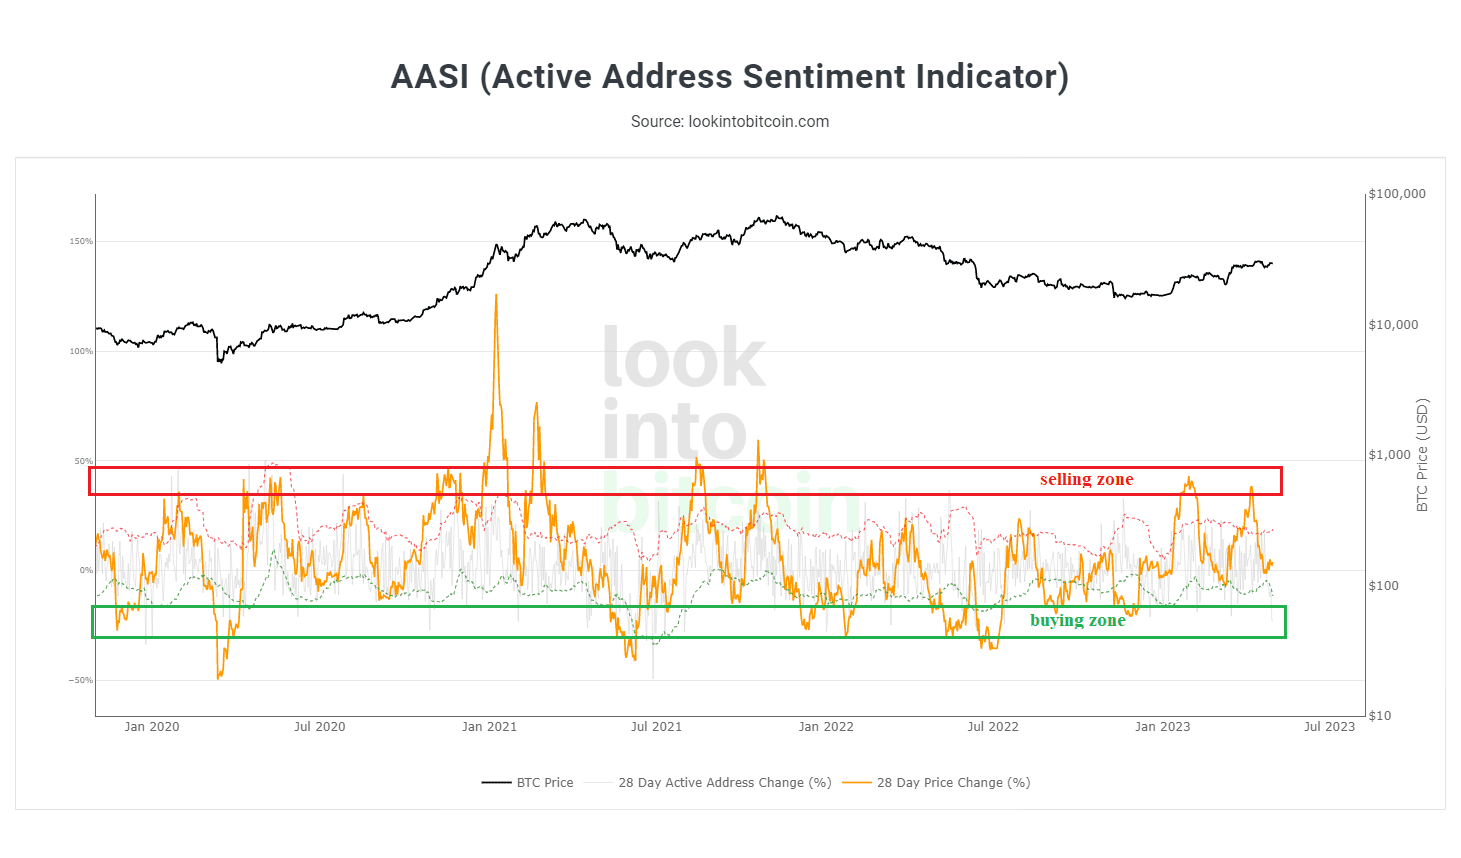
The Active Address Sentiment Indicator verisi bant ortası direnç bölgesinde gibi görünüyor. Genel olarak bitcoin fiyatı şu an ara bir değerde ve kararsız duruyor. Düşüş devam ederse önemli fiyat seviyeleriyle birlikte destek bölgesini takip edeceğiz.
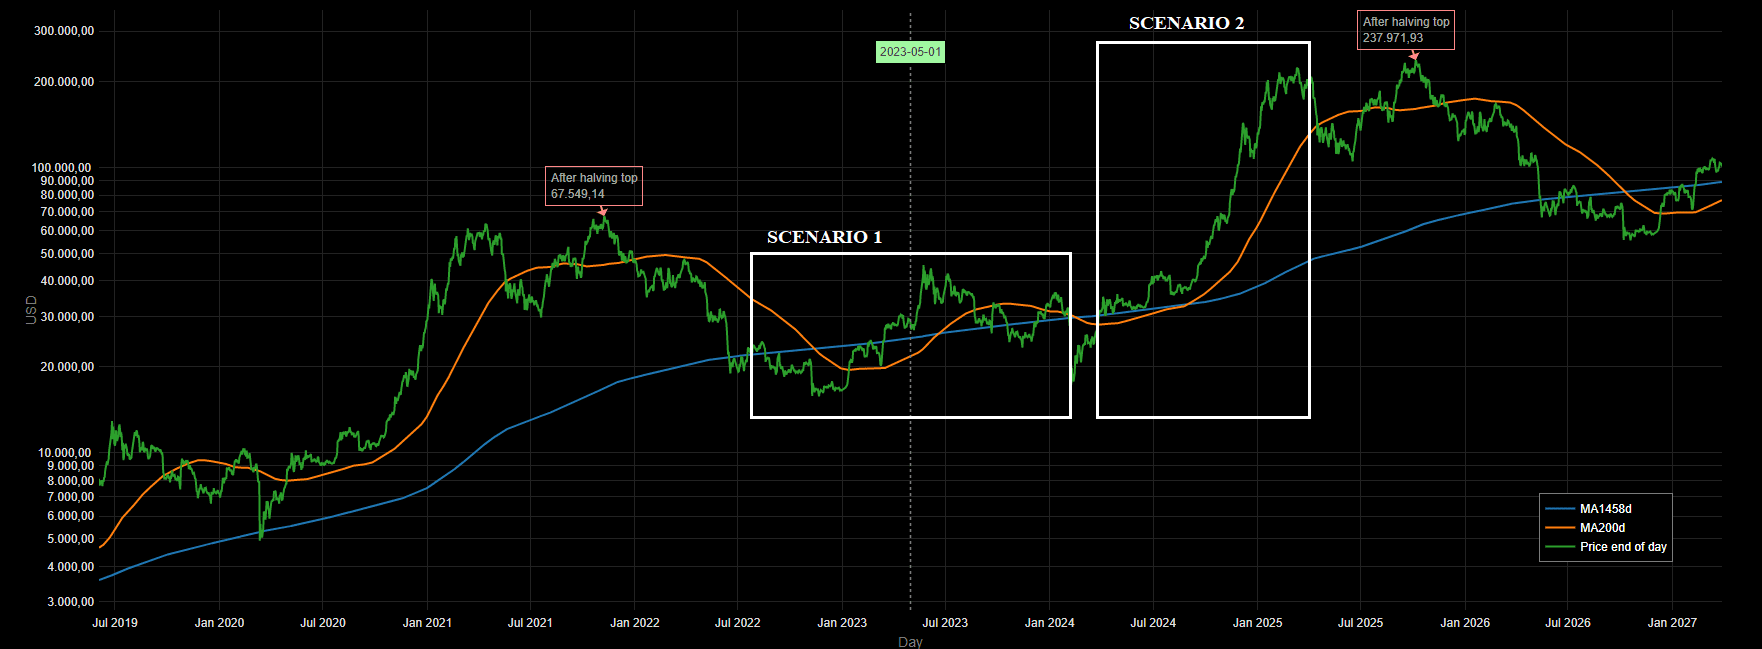
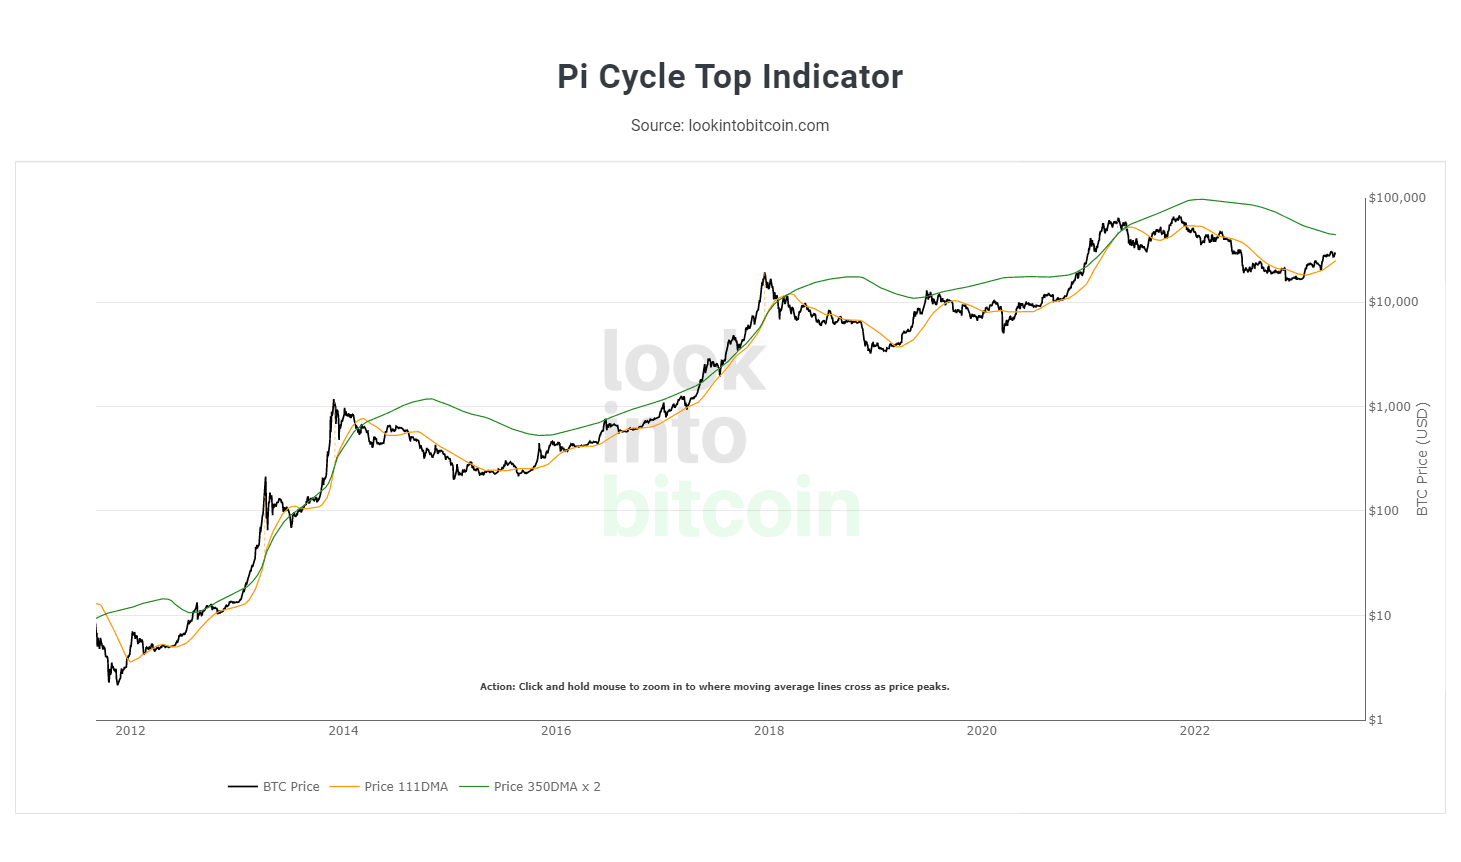
Cycle Repeat (Döngü Tekrarı) grafiği , son 1458 günün fiyat hareketlerini alır ve sonraki 1458 gün boyunca her gün fiyatı tahmin etmek için bu hareketleri tekrarlar. Turuncu bant, mavi bandı yukarı doğru kestiğinde boğa sezonu, turuncu bant mavi bandı aşağı doğru kestiğinde ayı sezonu yaşanmış. Önümüzdeki günlerde veya haftalarda tekrar bir bant kesişimi yaşanacak gibi görünüyor. Bant kesişimi olduğunda Bitcoin fiyatının nasıl bir tepki vereceğini izliyor olacağız.
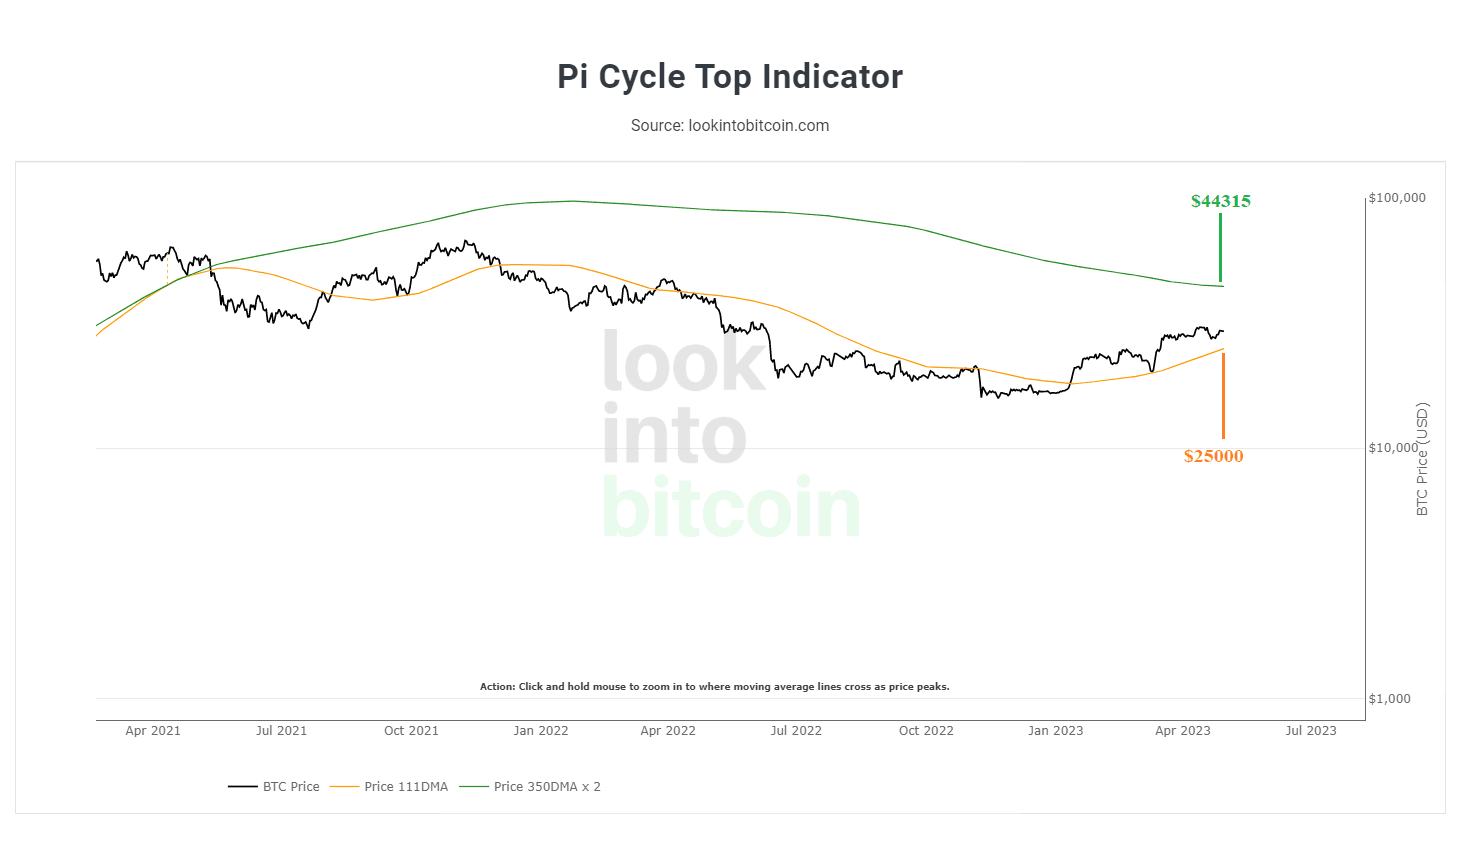
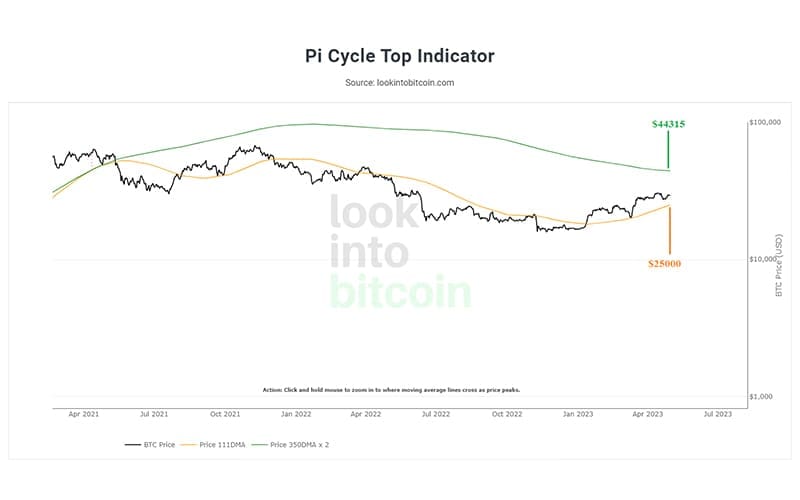
Bitcoin, geçmişte turuncu bant altındaki fiyat hareketinden sonra kendini turuncu bandın üstüne atarak yükseliş yaşamış. 2016-2018 yıllarında yeşil bant ve turuncu bant paralel olarak birlikte yükselmiş ve boğa sezonu yaşanmış. Ancak 2019-2020 yılları arasında Yeşil bant güçlü bir direnç olmuş ve ayı sezonu yaşanmış. Şu anki grafiğe göre turuncu bant desteği $25000, yeşil bant direnci $44315.
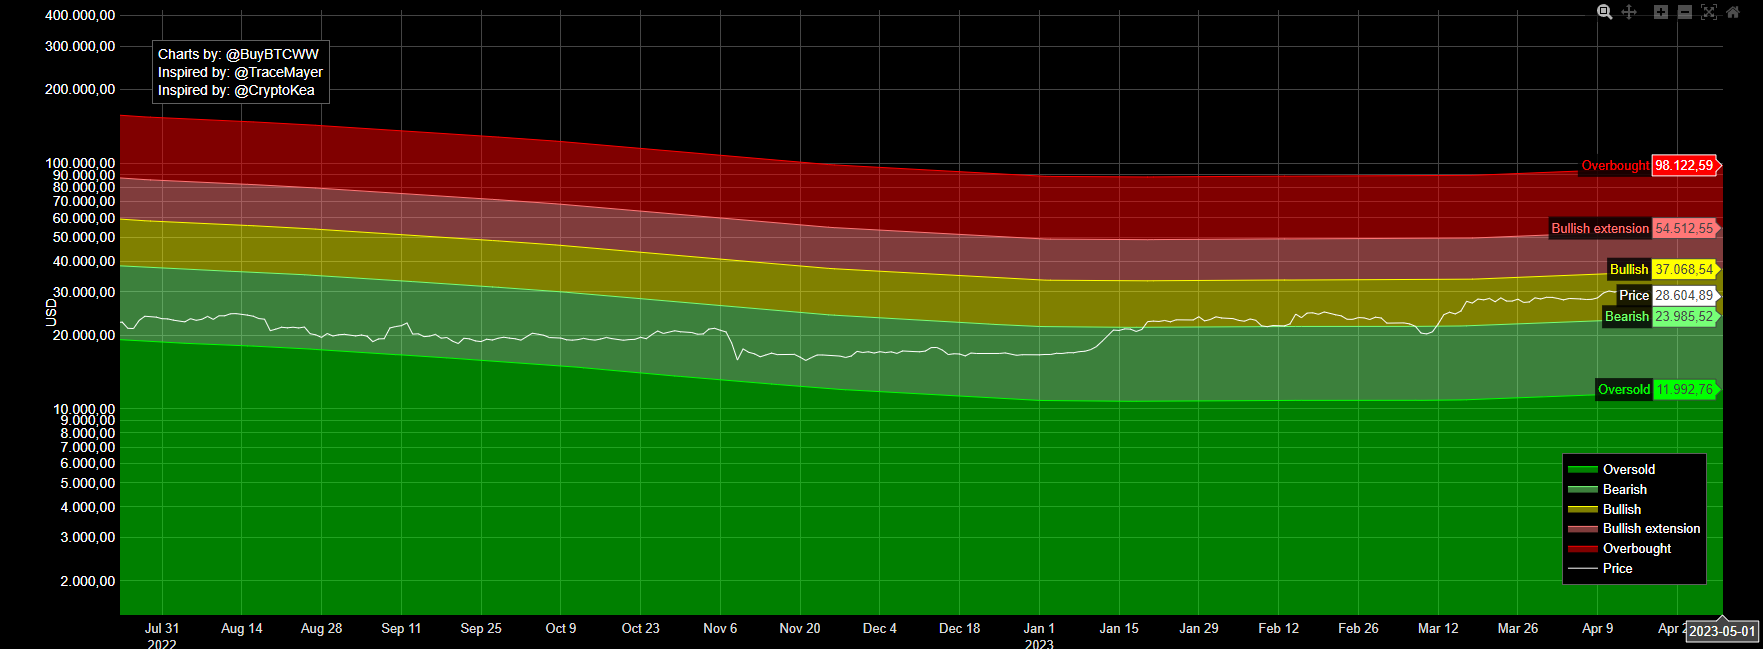
Bitcoinin bullish yapısını koruması için tutunması gereken seviye $23985. Daha da sert yükselişler yapabilmesi için $37070 seviyesini aşması beklenir. Tekrar derin bir ayı sezonu yaşanması durumunda izleyeceğimiz destek seviyesi $11992.
Onchain verileri ve açıklamalarına buradan göz atabilirsiniz.
Onchain analiz, blockchain piyasalarından elde edilen verilerden oluşur ve sadece borsalara giriş ve çıkışları yansıtır. Bu veriler olumlu veya olumsuz şekilde yorumlanabilir, ancak boğa veya ayı piyasasıyla ilgili kesin bir öngörü içermez. Yukarıda paylaşılan tüm analizler eğitim amaçlıdır, bu gönderi herhangi bir finansal tavsiye içermez.