


asda
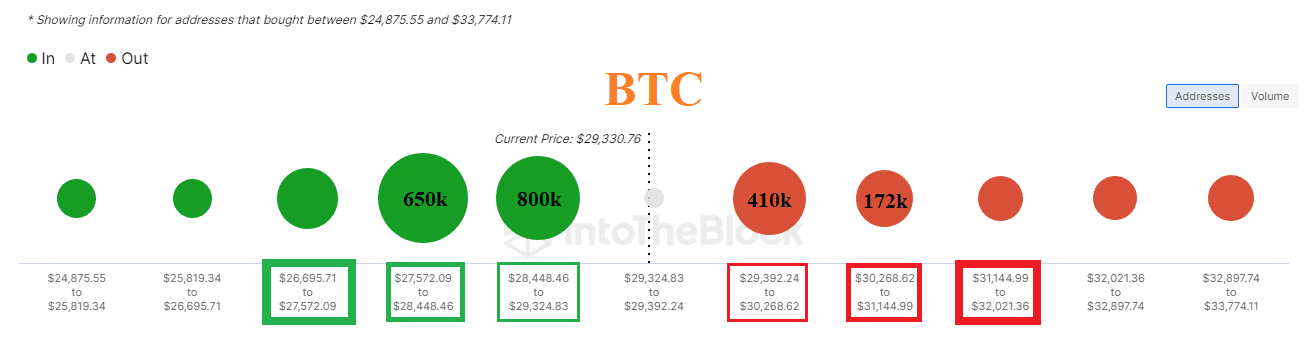
Onchain üzerinde $27572-$29324 aralığından bitcoin alan kullanıcılar yüksek karlılıkta görünüyor. $29392-$30500 maliyetli kullanıcılar ise zararda görünüyor. Kırmızı küreler ne kadar büyük , yeşil küreler ne kadar küçük ise yükseliş ihtimali o kadar yükselir. Yeşil küreler ne kadar büyük, kırmızılar küreler ne kadar küçük ise düşüş ihtimali o kadar yükselir. Kürelerin bulunduğu seviye aralıkları güçlü destek ya da güçlü direnç olarak çalışabilir.
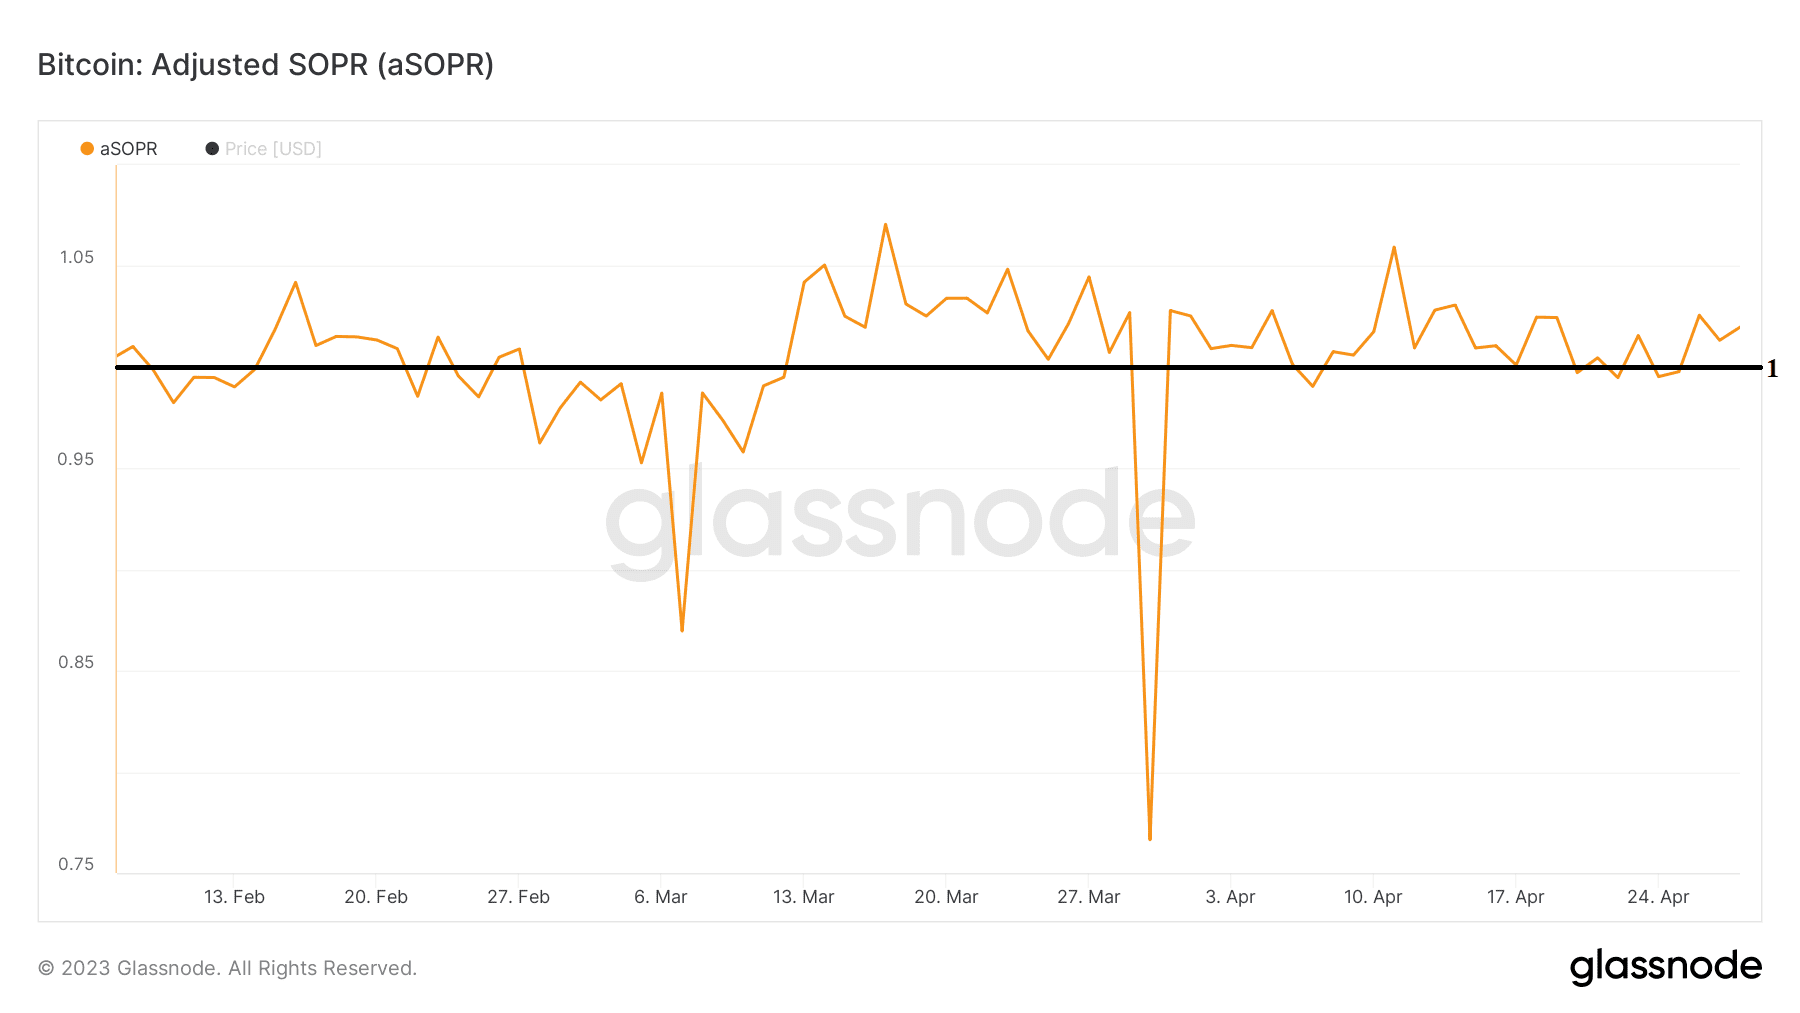
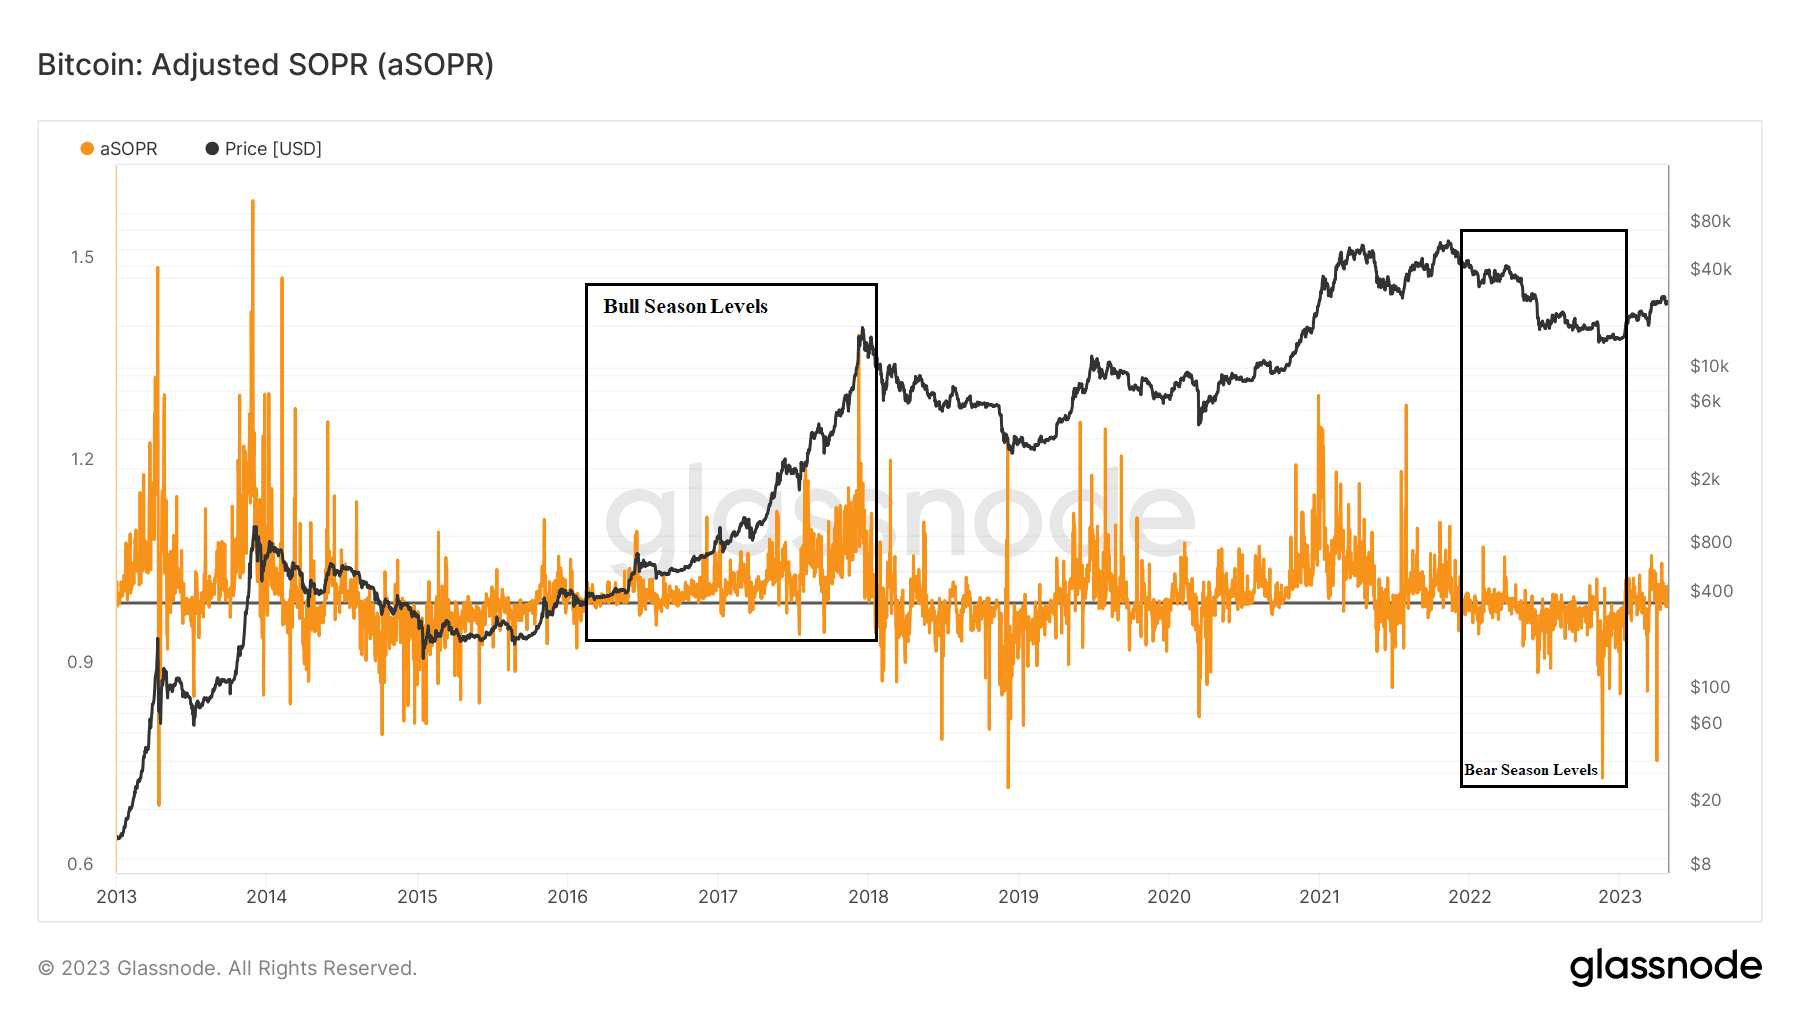
ASOPR verisi boğa sezonlarında çoğunlukla 1 seviyesi ve üzerinde, ayı sezonunda 1 seviyesi ve altında performans göstermiş. Bitcoin boğa sezonunda ise bu verinin 1 seviyesinden yukarıda tutunması gerekir.
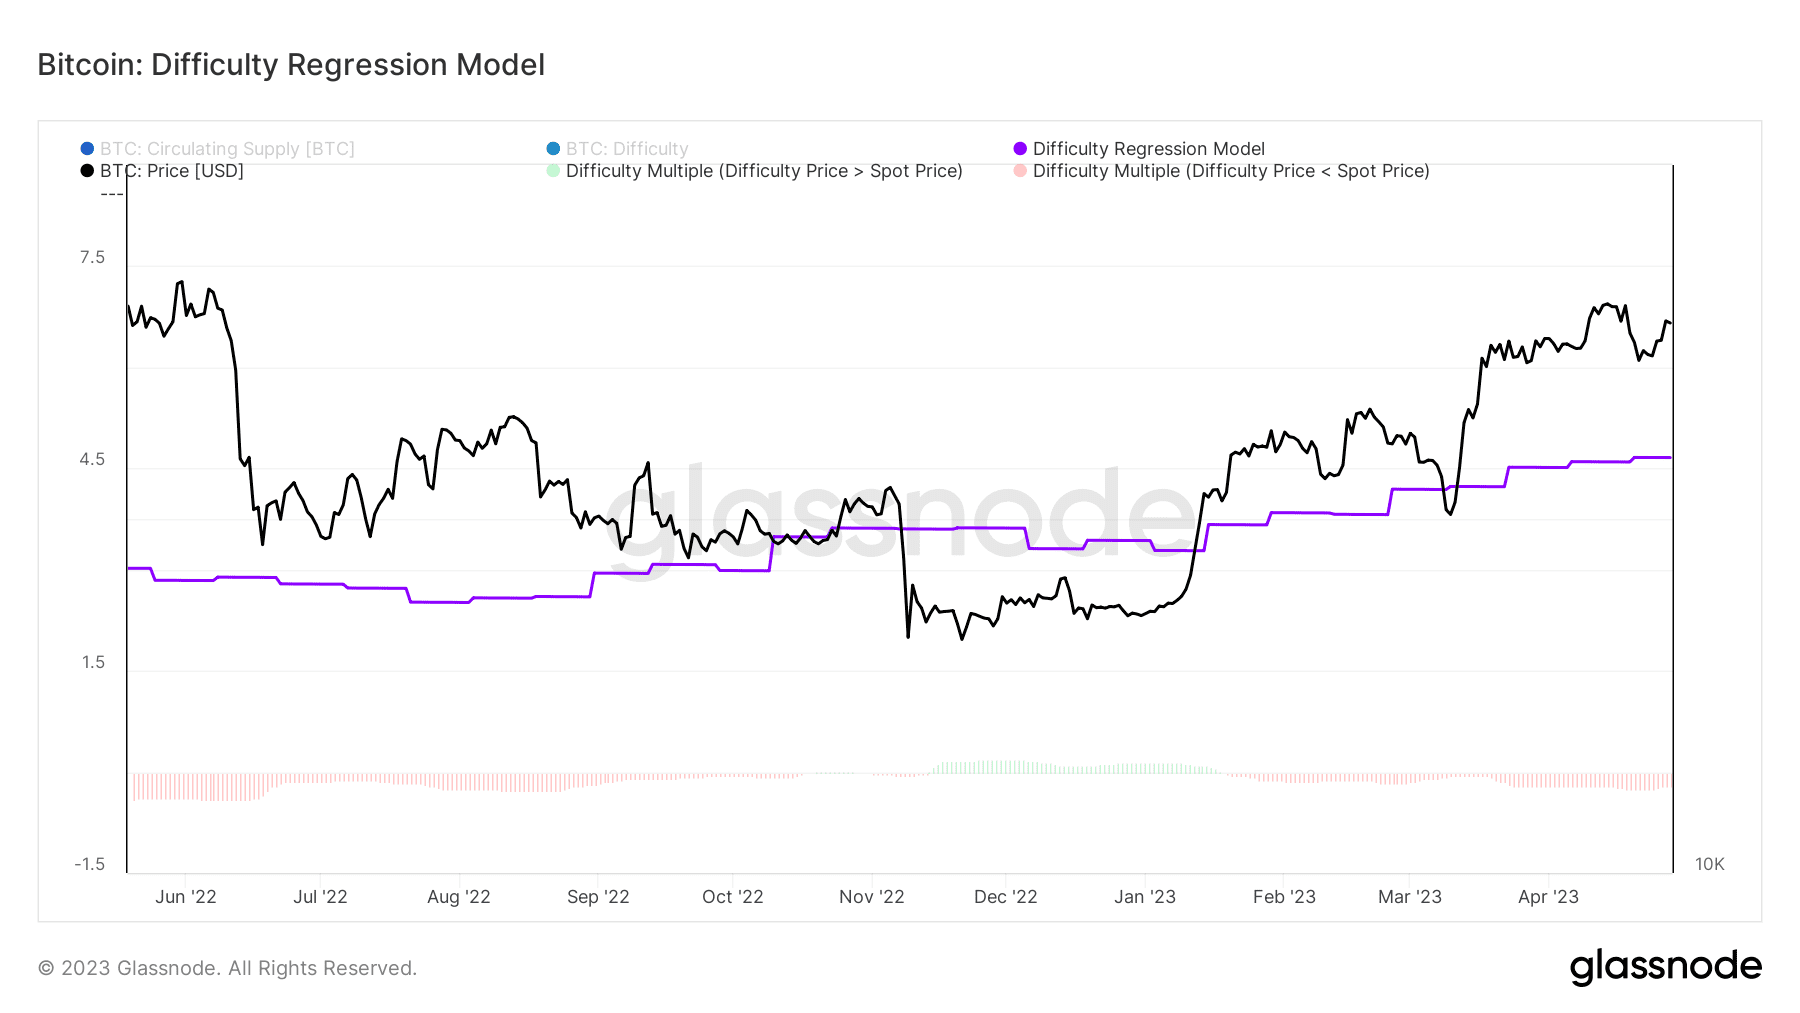
Madencilerin Bitcoin kazım maliyeti $22555. Şu anki duruma bakılırsa madenciler oldukça kârlı Bitcoin kazımı yapıyorlar.
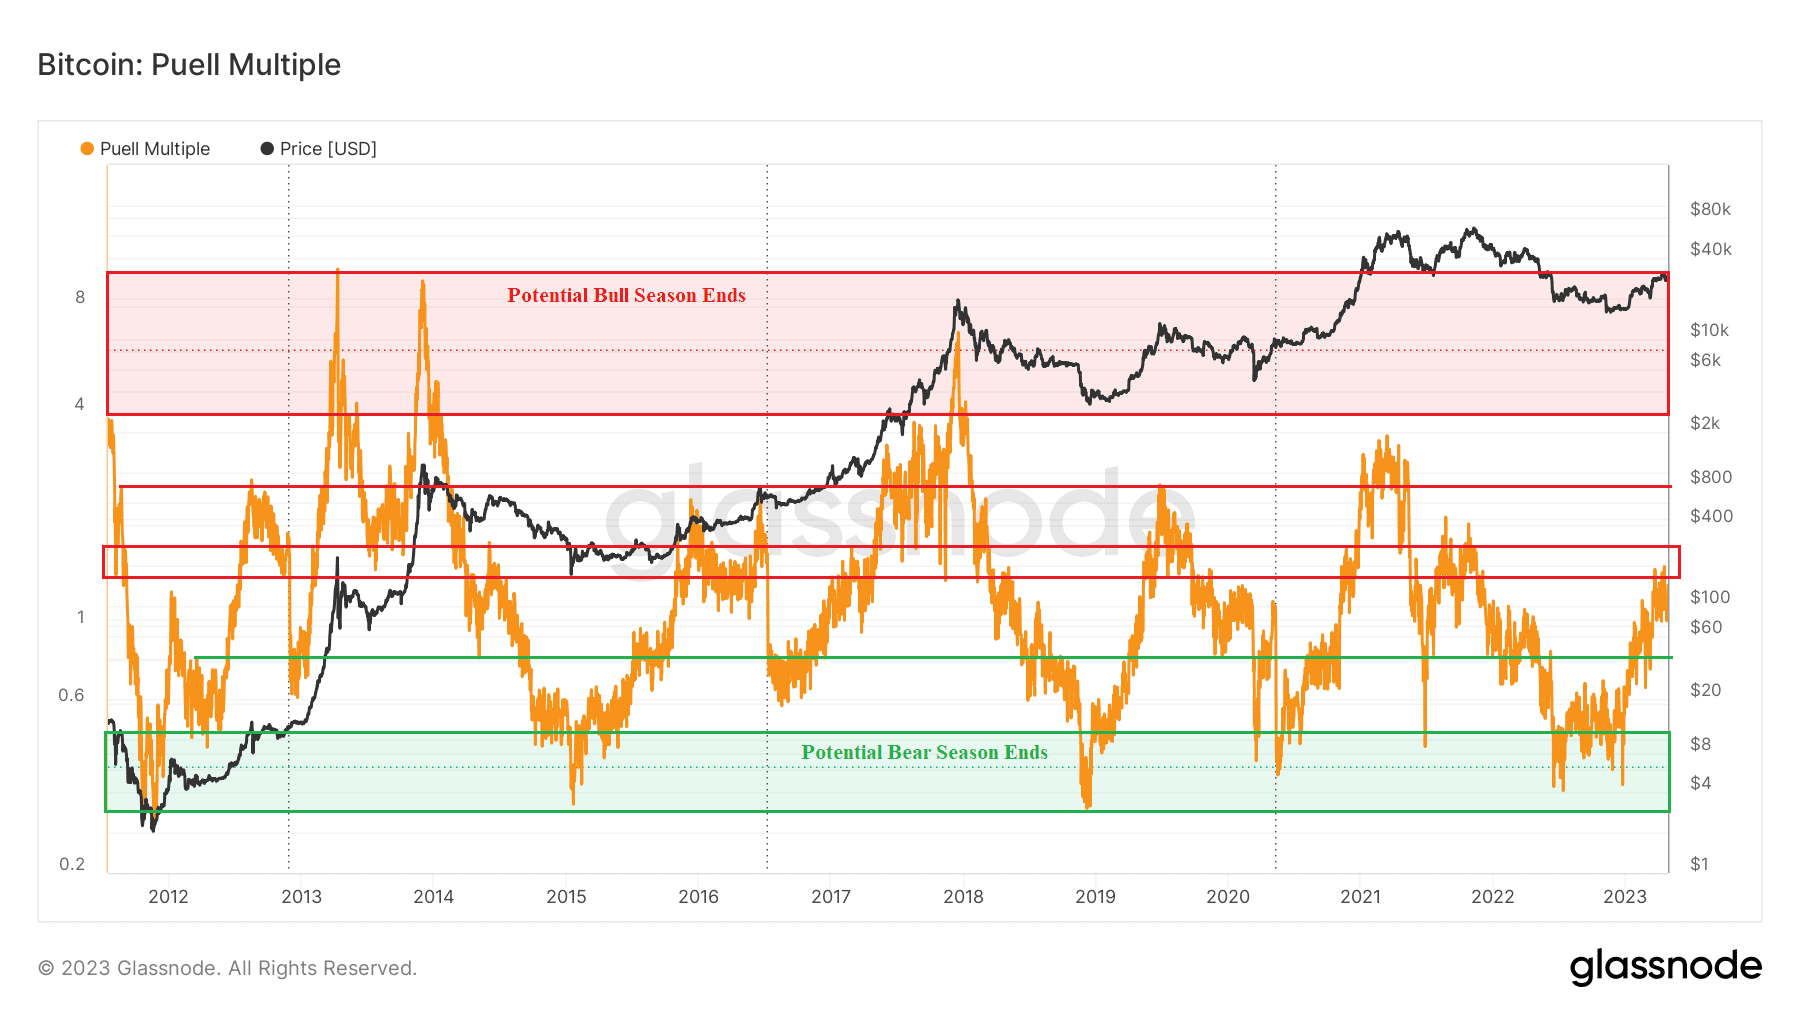
Madencilerin kârlılık durumunu gösteren Puell Multiple grafiği ise şu anda ara bir dirençte görünüyor. Bu durum bize, madencilerin karlılık durumunun fazla olduğunu ve kısa vadede kâr satışı yapmalarının muhtemel olduğunu gösteriyor. Kırmızı alan muhtemel boğa sezonu sonunu, yeşil alan ise muhtemel ayı sezonu sonunu ifade ediyor.
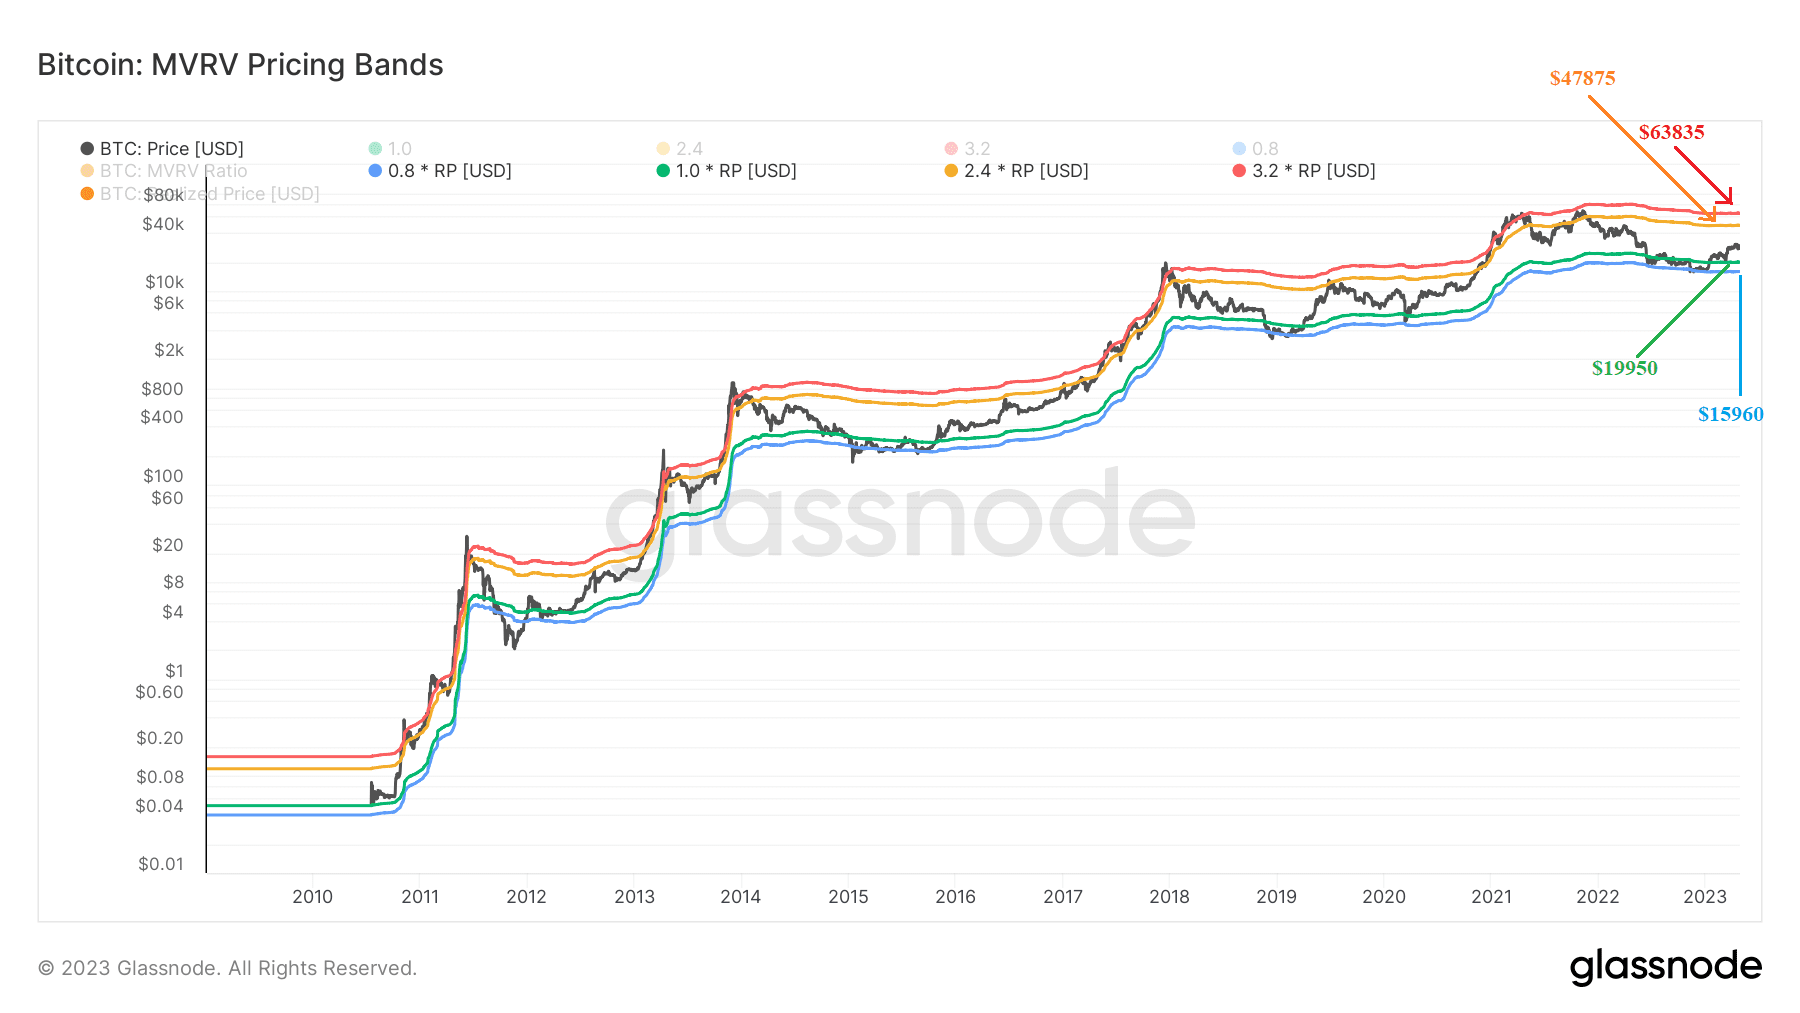
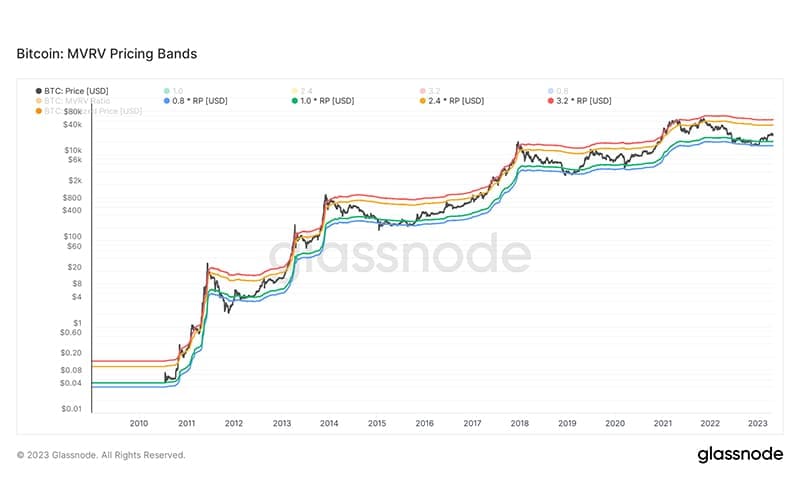
Bitcoin, geçmişte yeşil ve mavi bantlar arasındaki hareketinden sonra yükseliş yaşamış ve ardından turuncu banda kadar yükseliş göstermiş. Kesinlik yok ancak şu anki fiyat hareketi de aynı şekilde olursa bugünkü turuncu direnç $47875. Yeşil destek bandı fiyatı $19950.
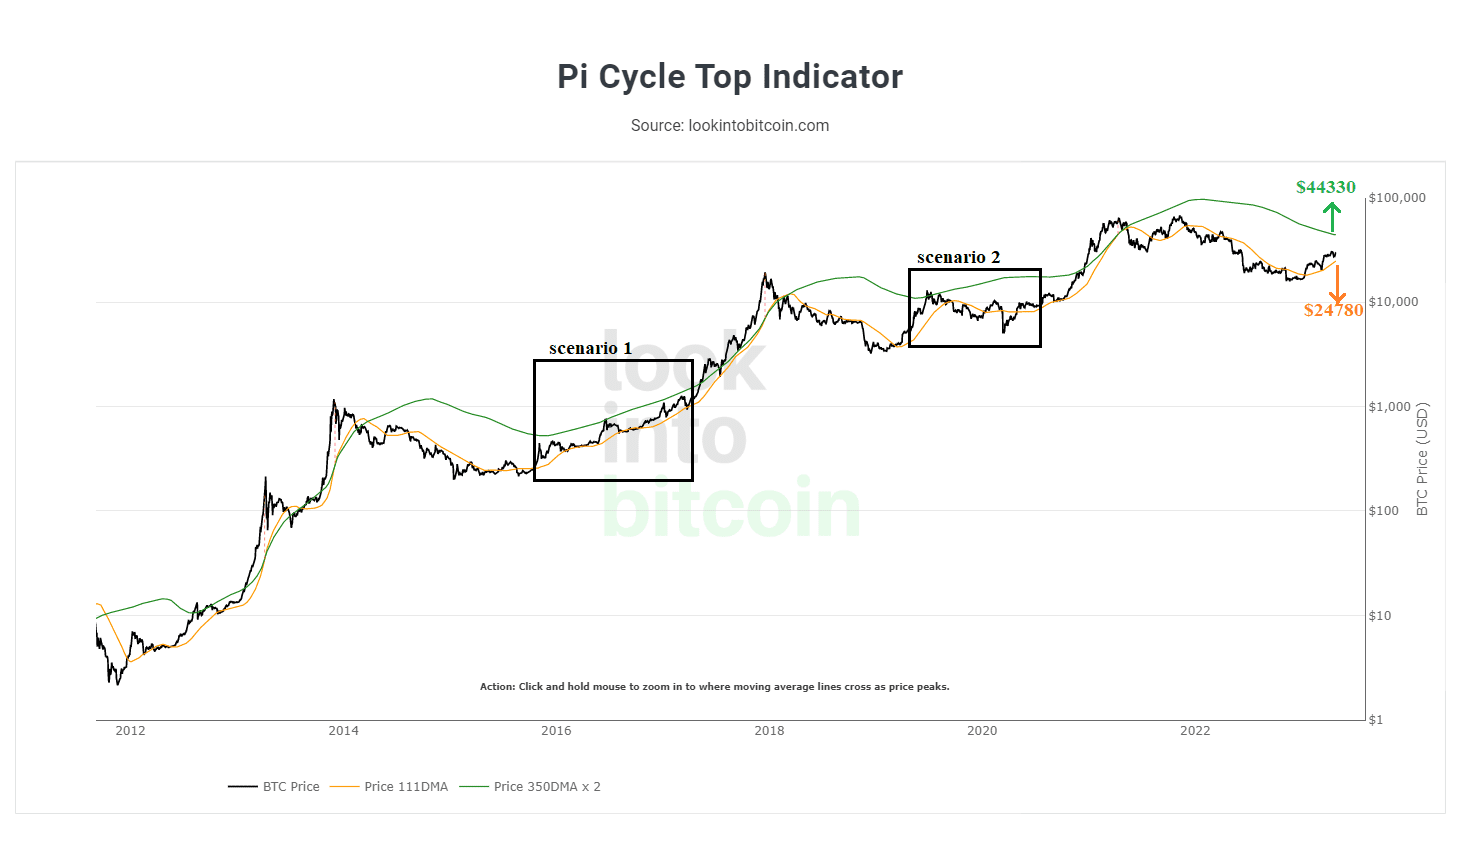
Bitcoin, geçmişte turuncu bant altındaki fiyat hareketinden sonra kendini turuncu bandın üstüne atarak yükseliş yaşamış. 2016-2018 yıllarında yeşil bant ve turuncu bant paralel olarak birlikte yükselmiş ve boğa sezonu yaşanmış. Ancak 2019-2020 yılları arasında Yeşil bant güçlü bir direnç olmuş ve ayı sezonu yaşanmış. Şu anki grafiğe göre turuncu bant desteği $24780, yeşil bant direnci $44330. Hangi Senaryonun çalışacağını izliyor olacağız.
Onchain verileri ve açıklamalarına buradan göz atabilirsiniz.
Onchain analiz, blockchain piyasalarından elde edilen verilerden oluşur ve sadece borsalara giriş ve çıkışları yansıtır. Bu veriler olumlu veya olumsuz şekilde yorumlanabilir, ancak boğa veya ayı piyasasıyla ilgili kesin bir öngörü içermez. Yukarıda paylaşılan tüm analizler eğitim amaçlıdır, bu gönderi herhangi bir finansal tavsiye içermez.