


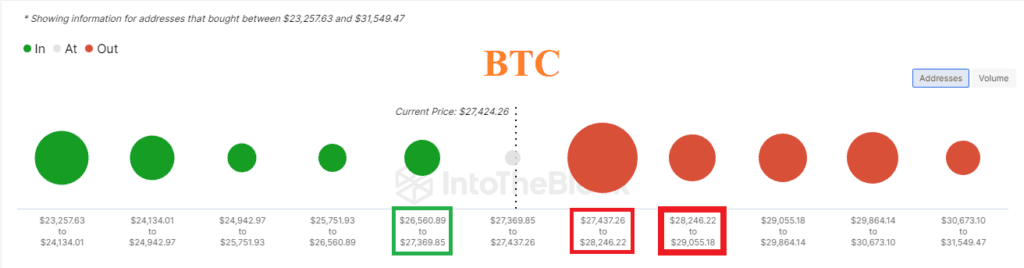
Onchain üzerinde $27450-29055 aralığından bitcoin alan kullanıcılar yüksek zararda görünüyor. Kırmızı küreler ne kadar büyük , yeşil küreler ne kadar küçük ise yükseliş ihtimali o kadar yükselir. Yeşil küreler ne kadar büyük, kırmızılar küreler ne kadar küçük ise düşüş ihtimali o kadar yükselir. Kürelerin bulunduğu seviye aralıkları güçlü destek ya da güçlü direnç olarak çalışabilir. Şu anki aşamada bitcoin, desteğe ve tepki yükselişine yaklaşıyor gibi görünüyor.
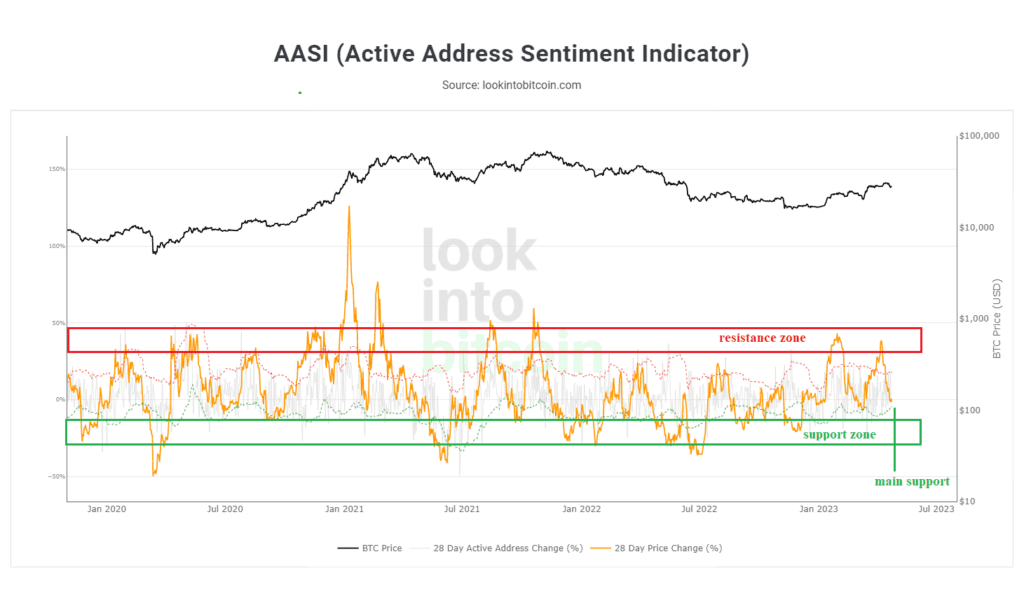
The Active Address Sentiment Indicator verisi 21 Nisan’da belirttiğimiz seviyeden daha da aşağıya gerilemiş görünüyor. Düşüş devam ettikçe desteğe daha da yaklaşıyor.
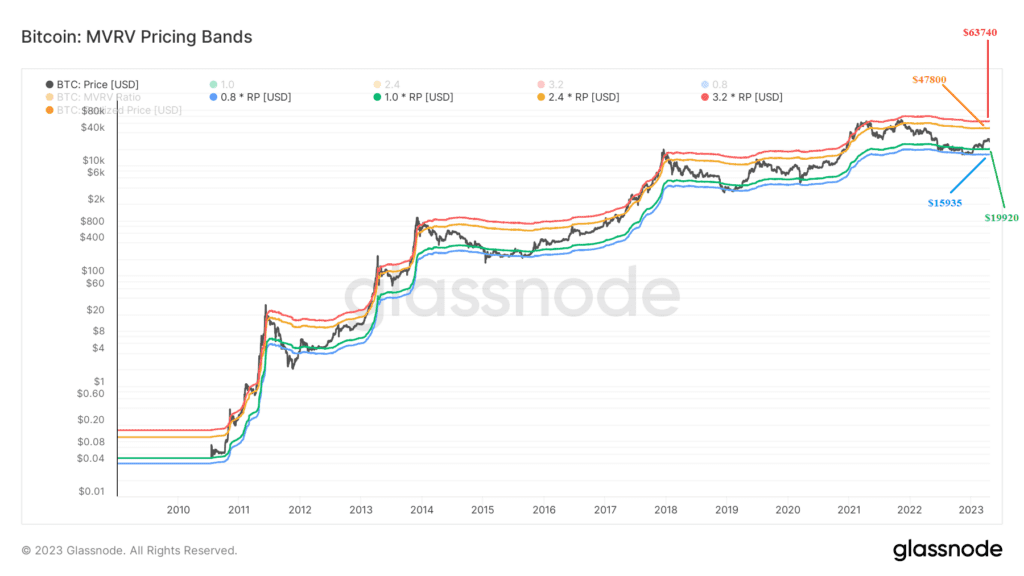
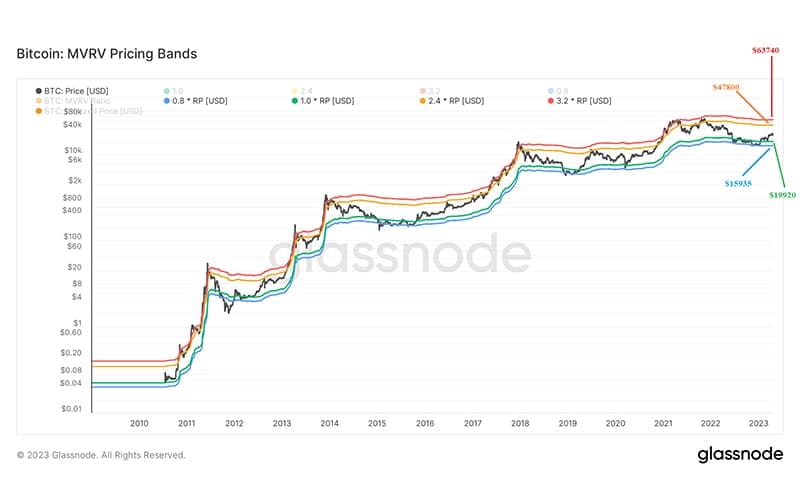
Bitcoin, geçmişte yeşil ve mavi bantlar arasındaki hareketinden sonra yükseliş yaşamış ve ardından turuncu banda kadar yükseliş göstermiş. Kesinlik yok ancak şu anki fiyat hareketi de aynı şekilde olursa bugünkü turuncu direnç 47792$. Destek bandı fiyatı $19920.
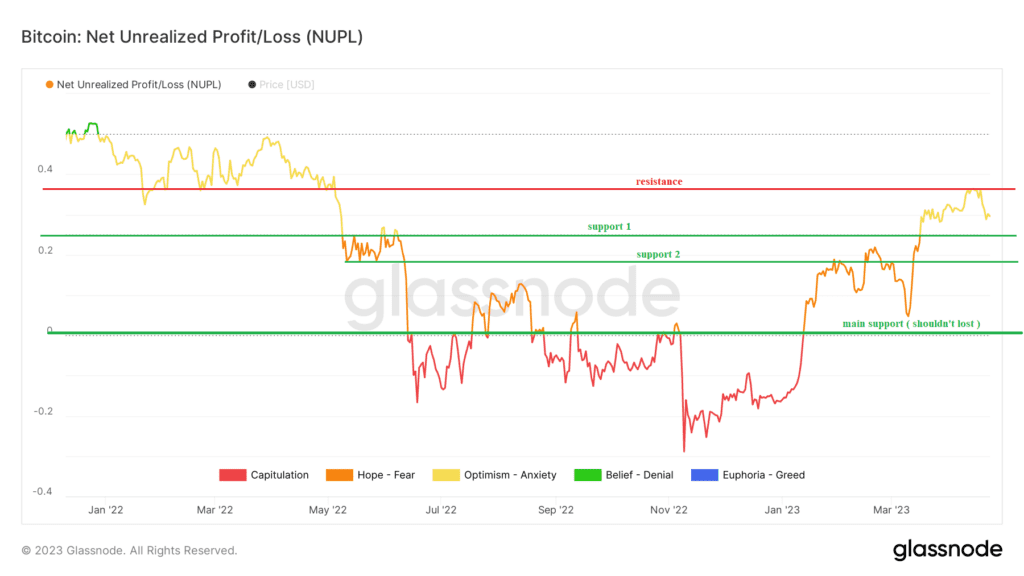
Bitcoin, yukarıdaki direnci geçemediği için sert bir düşüş yaşamış görünüyor. İyimserlik-kaygı bölgesini koruması gerekiyor aksi halde düşüş daha da derinleşebilir.
Bu veride Bitcoin’in 15000$’dan 31000$’a yükselişi önceki yıllara göre daha iyi performans göstermiş görünüyor. Ancak fiyata yansıması olarak pek öyle görünmüyor. Elbette bu veri tek başına yeterli değil ancak bu verilere göre Bitcoin fiyatının aşağı gitmesi için daha çok yolu var gibi görünüyor.
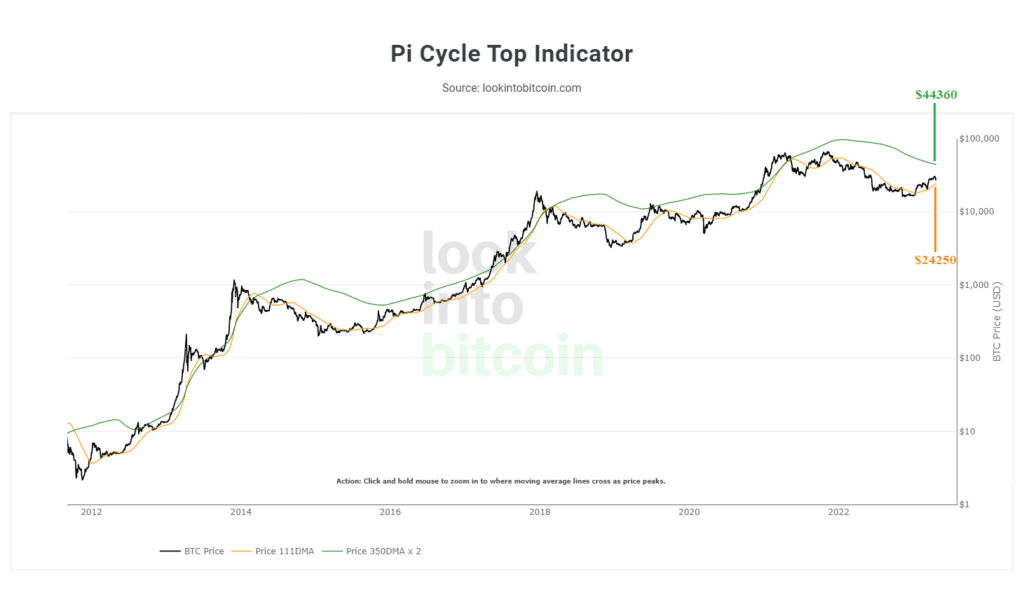
Bitcoin, geçmişte turuncu bant altındaki fiyat hareketinden sonra kendini turuncu bandın üstüne atarak yükseliş yaşamış. 2016-2018 yıllarında yeşil bant ve turuncu bant paralel olarak birlikte yükselmiş ve boğa sezonu yaşanmış. Ancak 2019-2020 yılları arasında Yeşil bant güçlü bir direnç olmuş ve ayı sezonu yaşanmış. Şu anki grafiğe göre turuncu bant desteği 24250$, yeşil bant direnci 44360$.
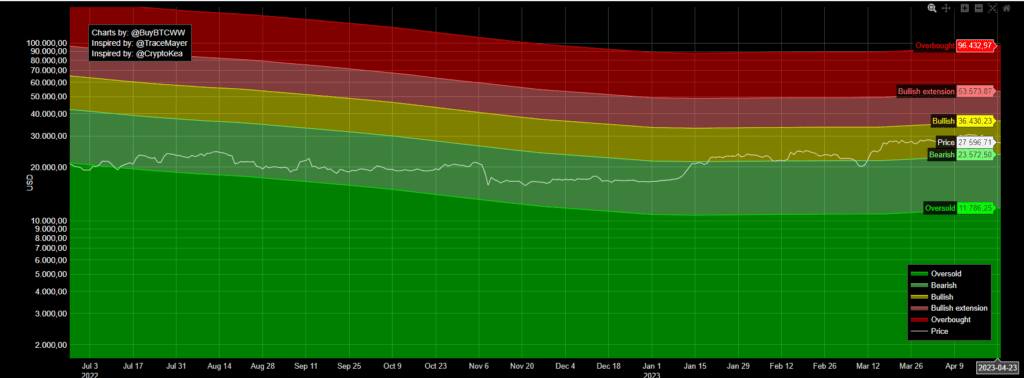
Bitcoinin bullish yapısını koruması için tutunması gereken seviye 23572$. Daha da sert yükselişler yapabilmesi için 36430$ seviyesini aşması beklenir. Tekrar derin bir ayı sezonu yaşanması durumunda izleyeceğimiz destek seviyesi $11786.
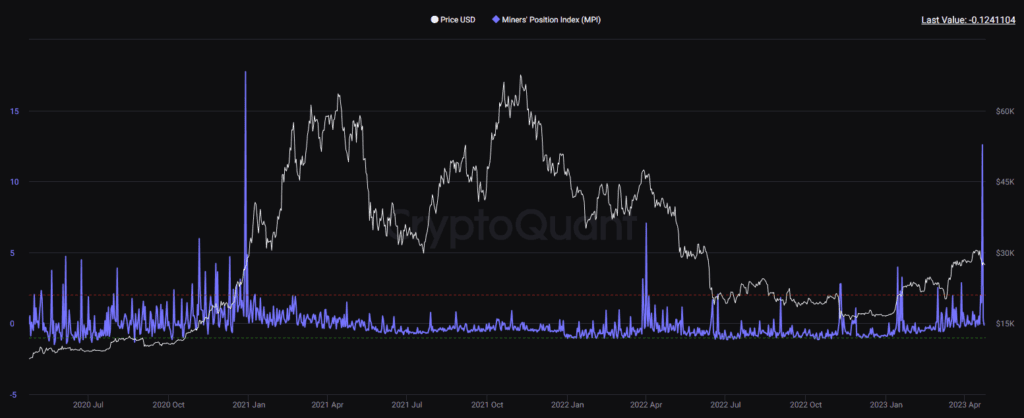
Miner Position Index (MPI), madencilerin ne kadar coin hareket ettirdiğini gösterir. Daha yüksek değer, madencilerin normalden daha fazla para gönderdiğini gösterir, bu da olası satışı gösterir. Madenciler rezervlerinin bir kısmını aynı anda gönderirse, fiyat düşüşünü tetikleyebilir. Son veri değeri 12.58.
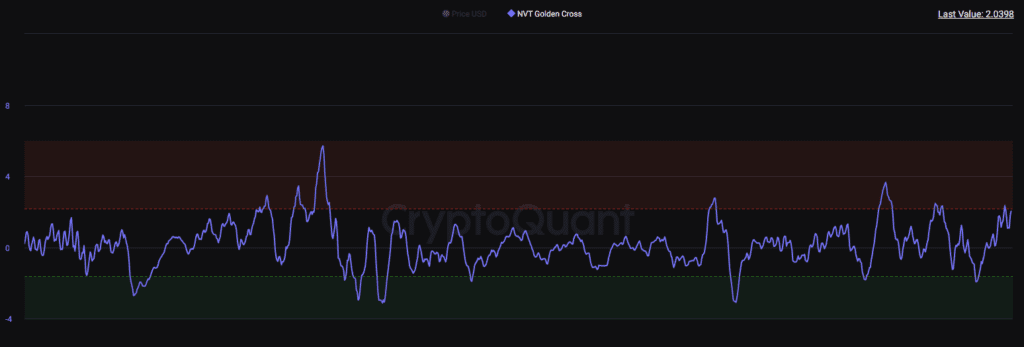
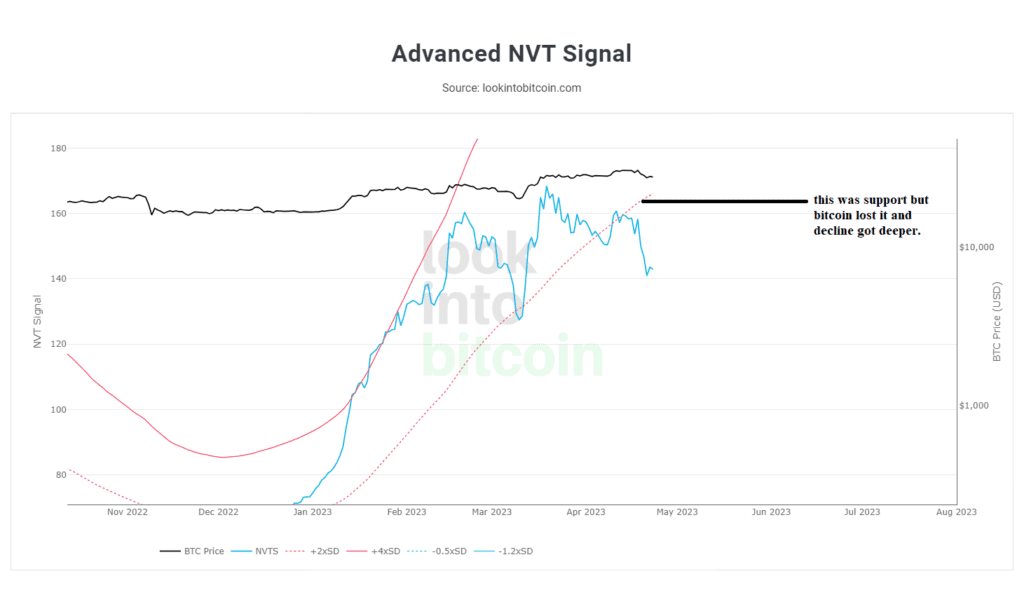
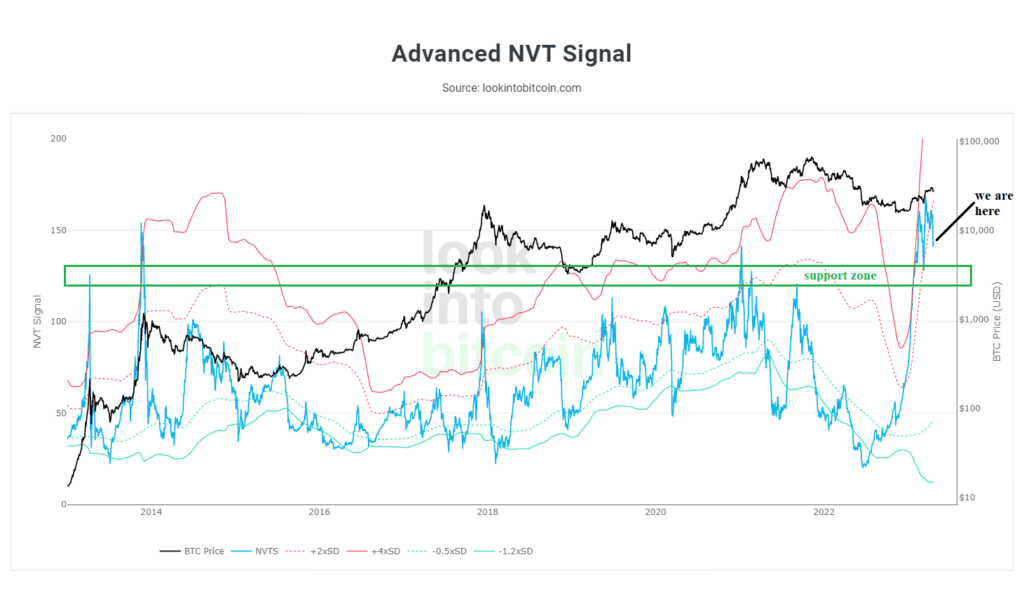
NVT Golden Cross yeniden risk bölgesine gelmiş görünüyor. Bu bölgede ne kadar kalacağını bilmiyoruz ama dikkatli olmalıyız. Fiyat düşüşünü daha fazla tetikleyebilir.
Onchain verileri ve açıklamalarına göz atabilirsiniz.
Onchain analiz, blockchain piyasalarından elde edilen verilerden oluşur ve sadece borsalara giriş ve çıkışları yansıtır. Bu veriler olumlu veya olumsuz şekilde yorumlanabilir, ancak boğa veya ayı piyasasıyla ilgili kesin bir öngörü içermez. Yukarıda paylaşılan tüm analizler eğitim amaçlıdır, bu gönderi herhangi bir finansal tavsiye içermez.