


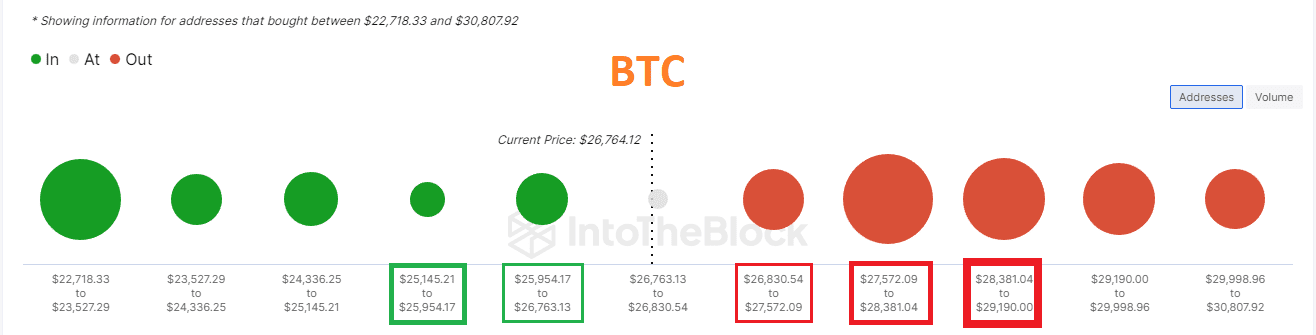
Onchain üzerinde $27572-$29190 maliyetli kullanıcılar yüksek zararda görünüyor. Kırmızı küreler ne kadar büyük , yeşil küreler ne kadar küçük ise yükseliş ihtimali o kadar yükselir. Yeşil küreler ne kadar büyük, kırmızılar küreler ne kadar küçük ise düşüş ihtimali o kadar yükselir. Kürelerin bulunduğu seviye aralıkları güçlü destek ya da güçlü direnç olarak çalışabilir.
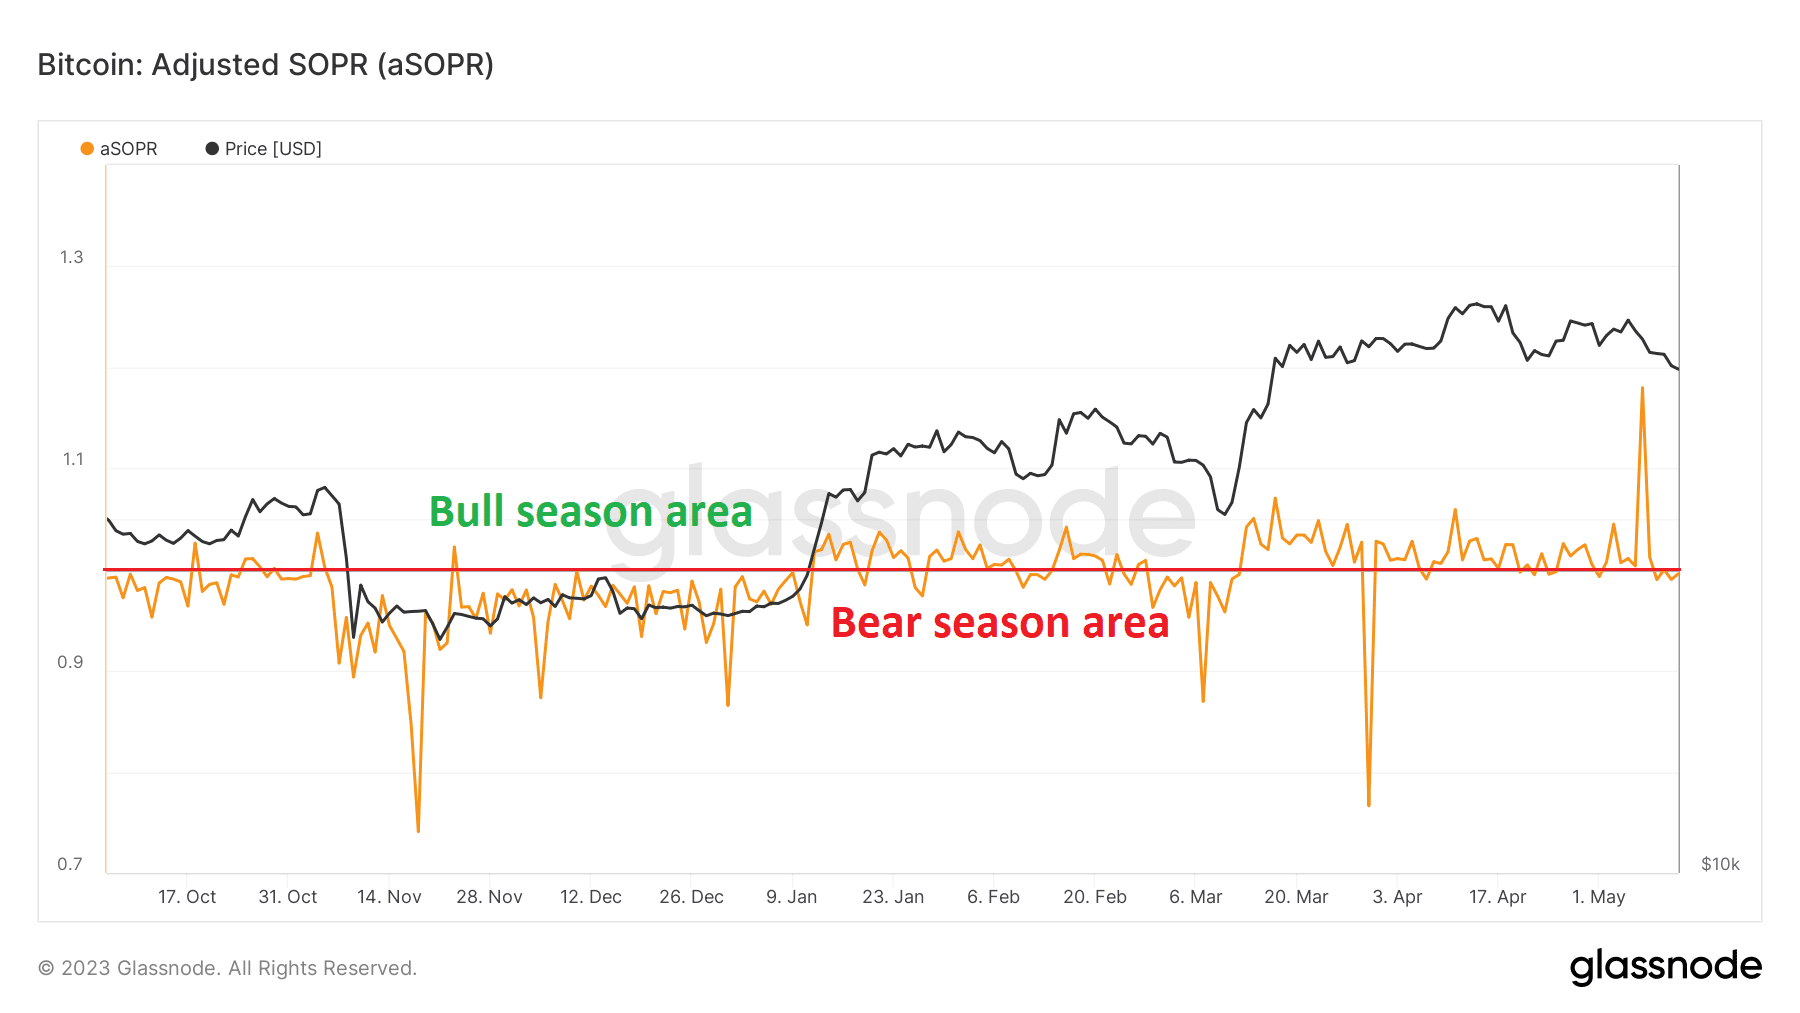
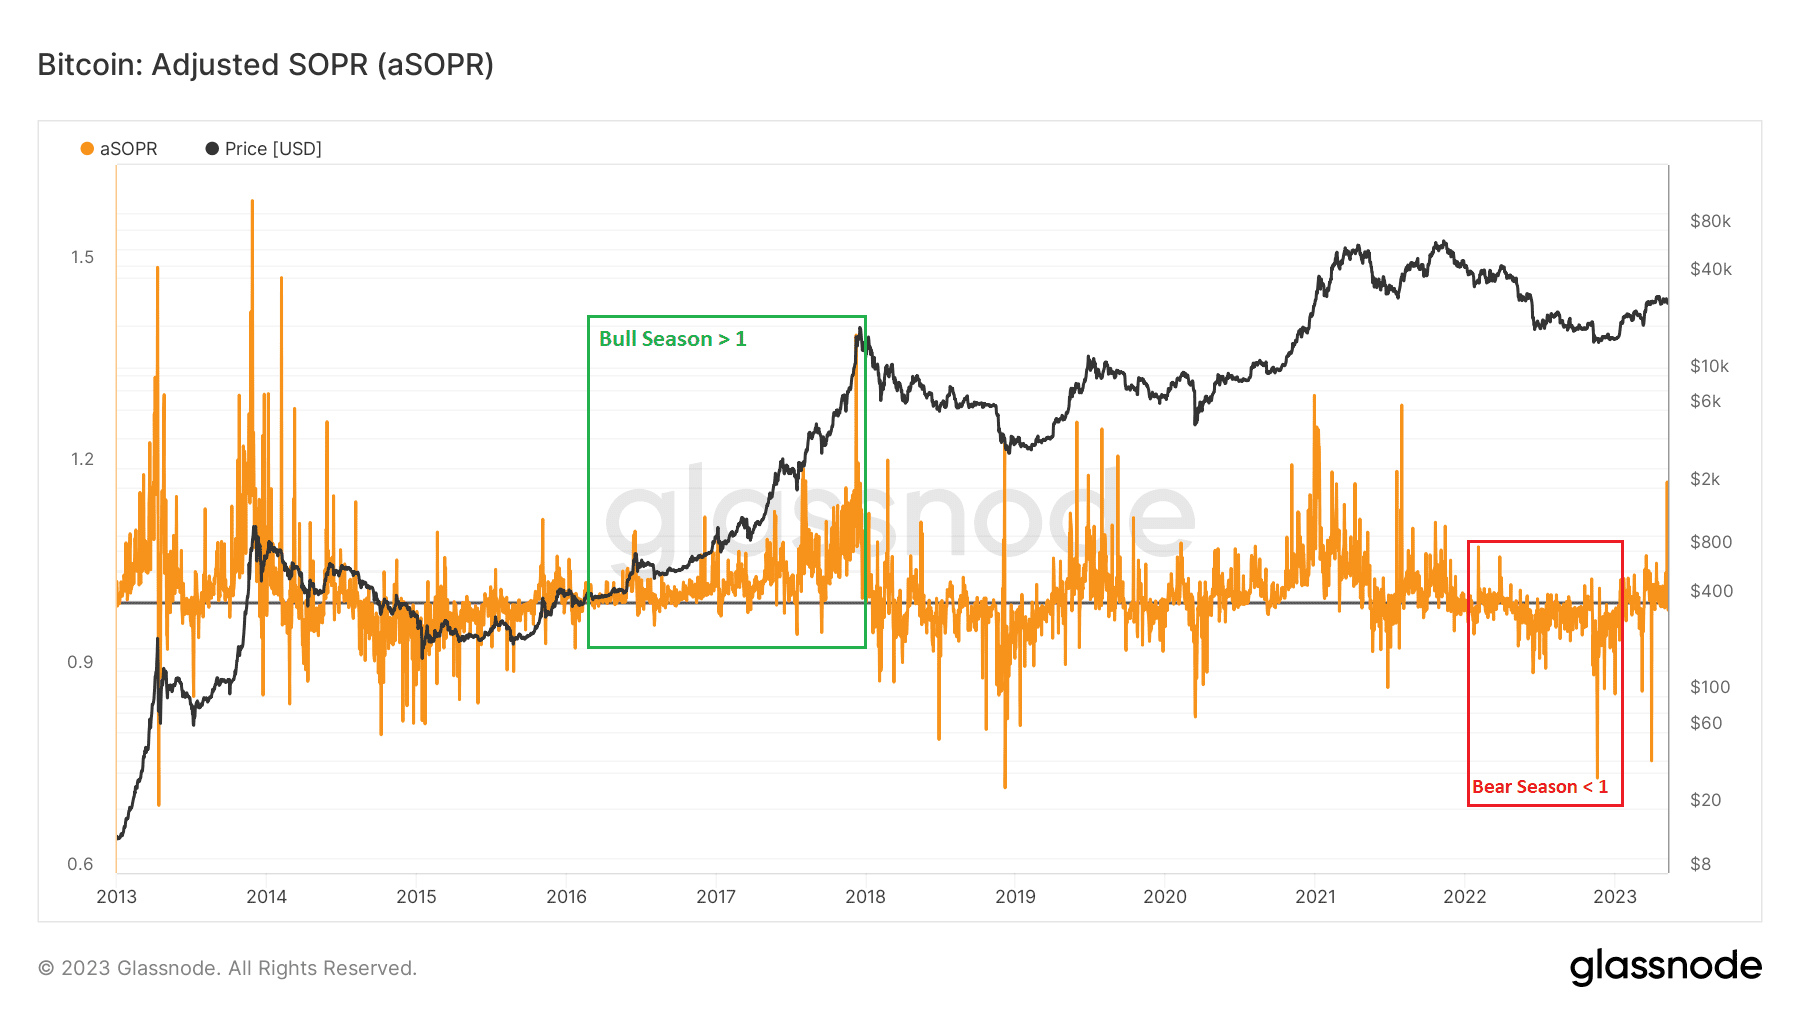
ASOPR verisi boğa sezonlarında çoğunlukla 1 seviyesi ve üzerinde, ayı sezonunda 1 seviyesi ve altında performans göstermiş. Bitcoin boğa sezonunda ise bu verinin 1 seviyesinden yukarıda tutunması gerekir.
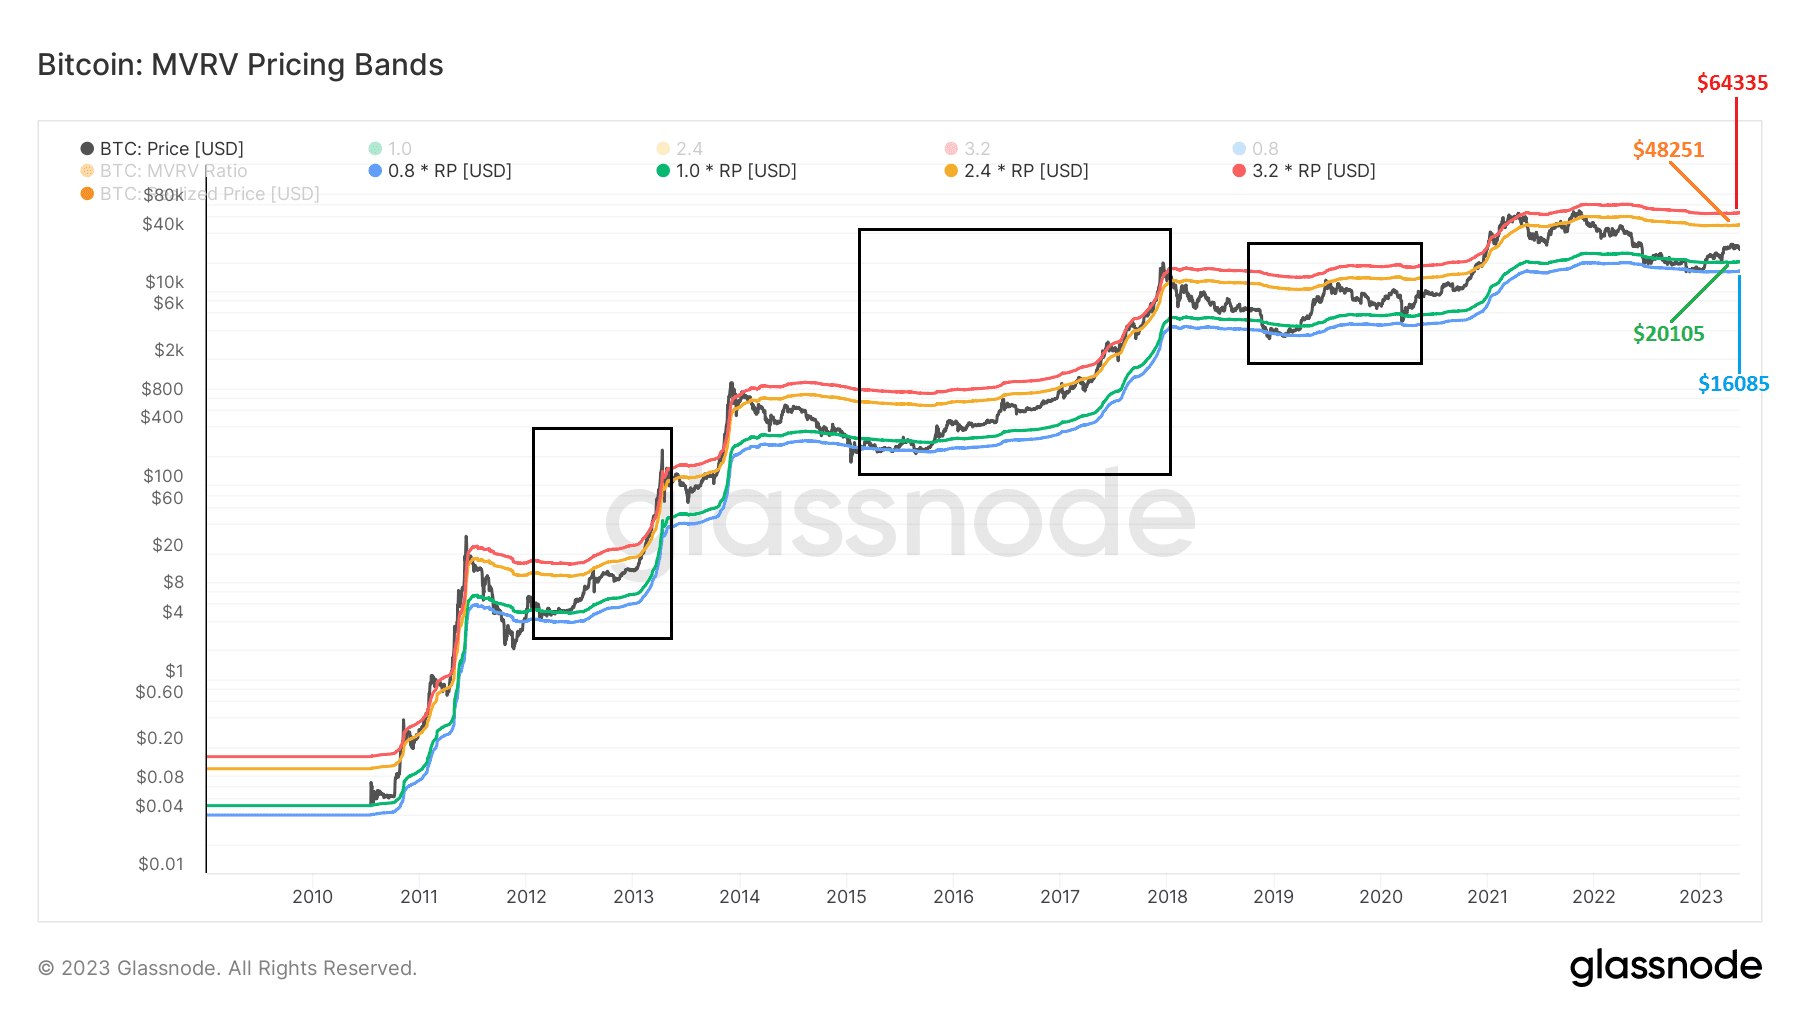
Bitcoin, geçmişte yeşil ve mavi bantlar arasındaki hareketinden sonra yükseliş yaşamış ve ardından turuncu banda kadar yükseliş göstermiş. Kesinlik yok ancak şu anki fiyat hareketi de aynı şekilde olursa bugünkü turuncu direnç $48251. Yeşil destek bandı fiyatı $20105.
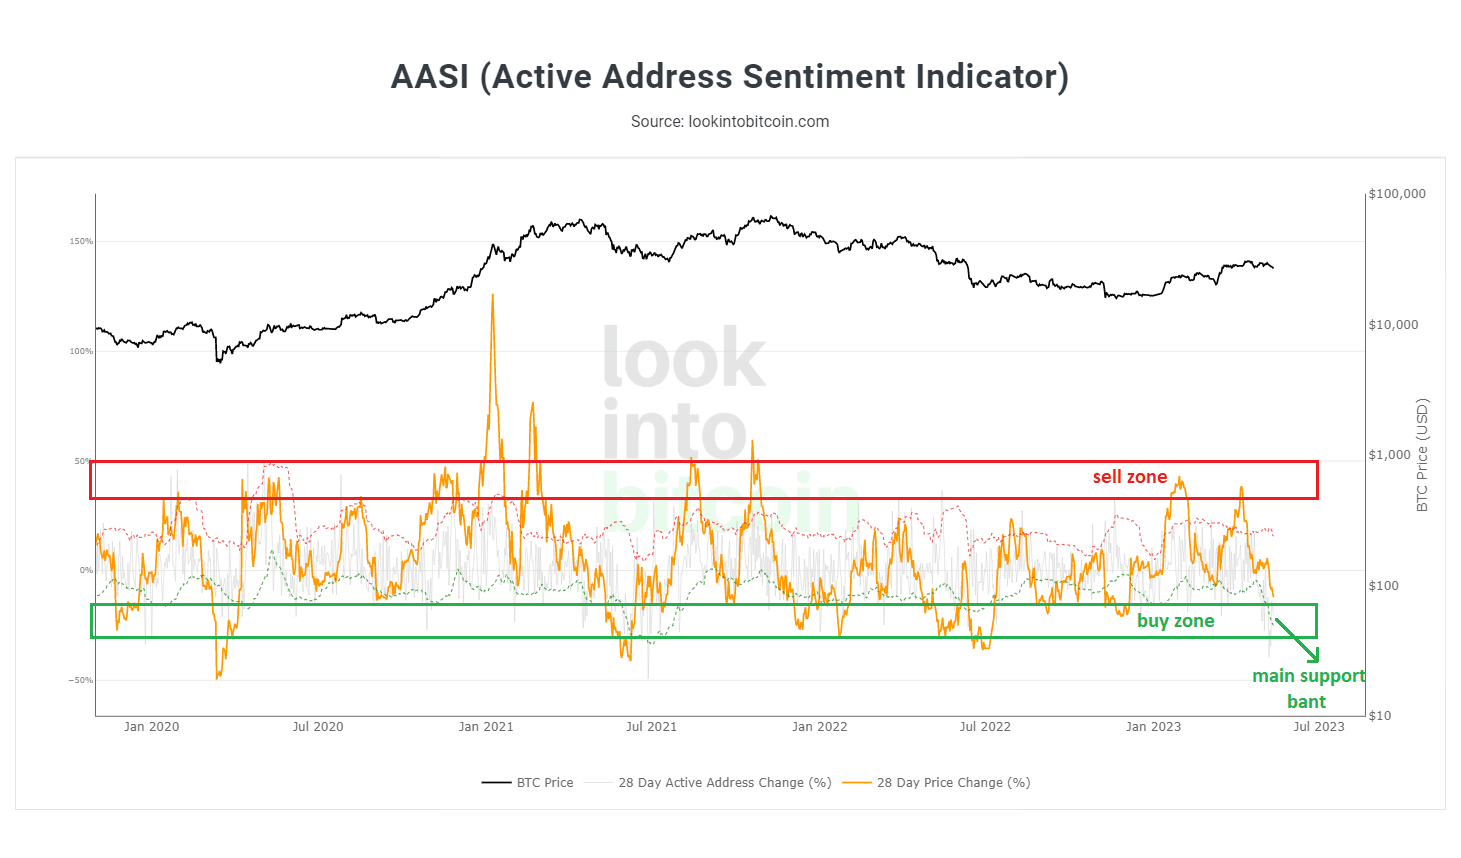
The Active Address Sentiment Indicator verisi, bant ortası direnç bölgesinden düşüş yaşamış ve ana destek bölgesine yaklaşmış görünüyor. Hiçbir veri tek başına yeterli değildir ancak alım için bu veri ile birlikte güçlü fiyat destek bölgeleri takip edilebilir.
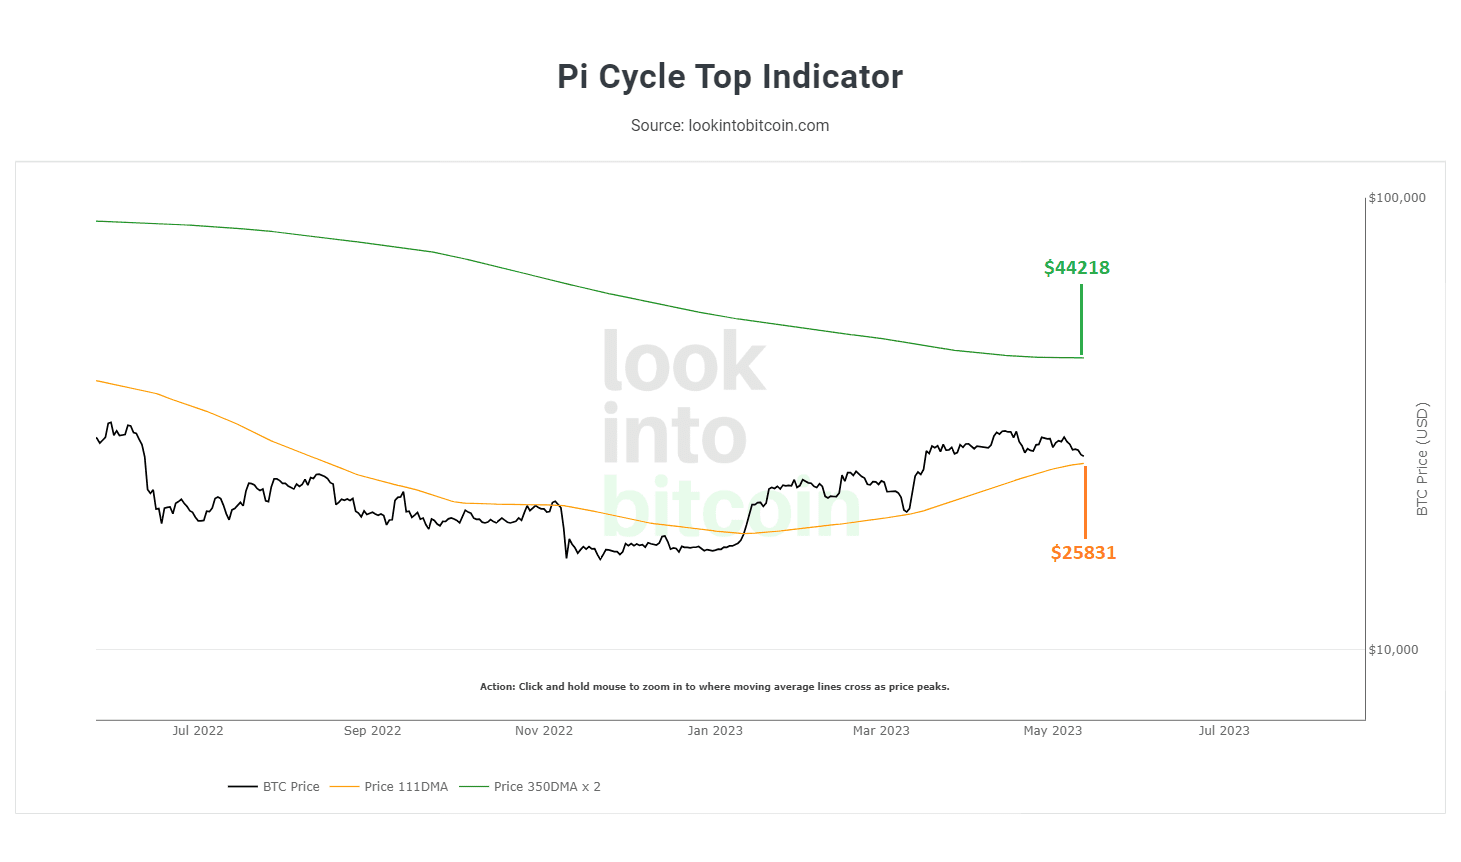
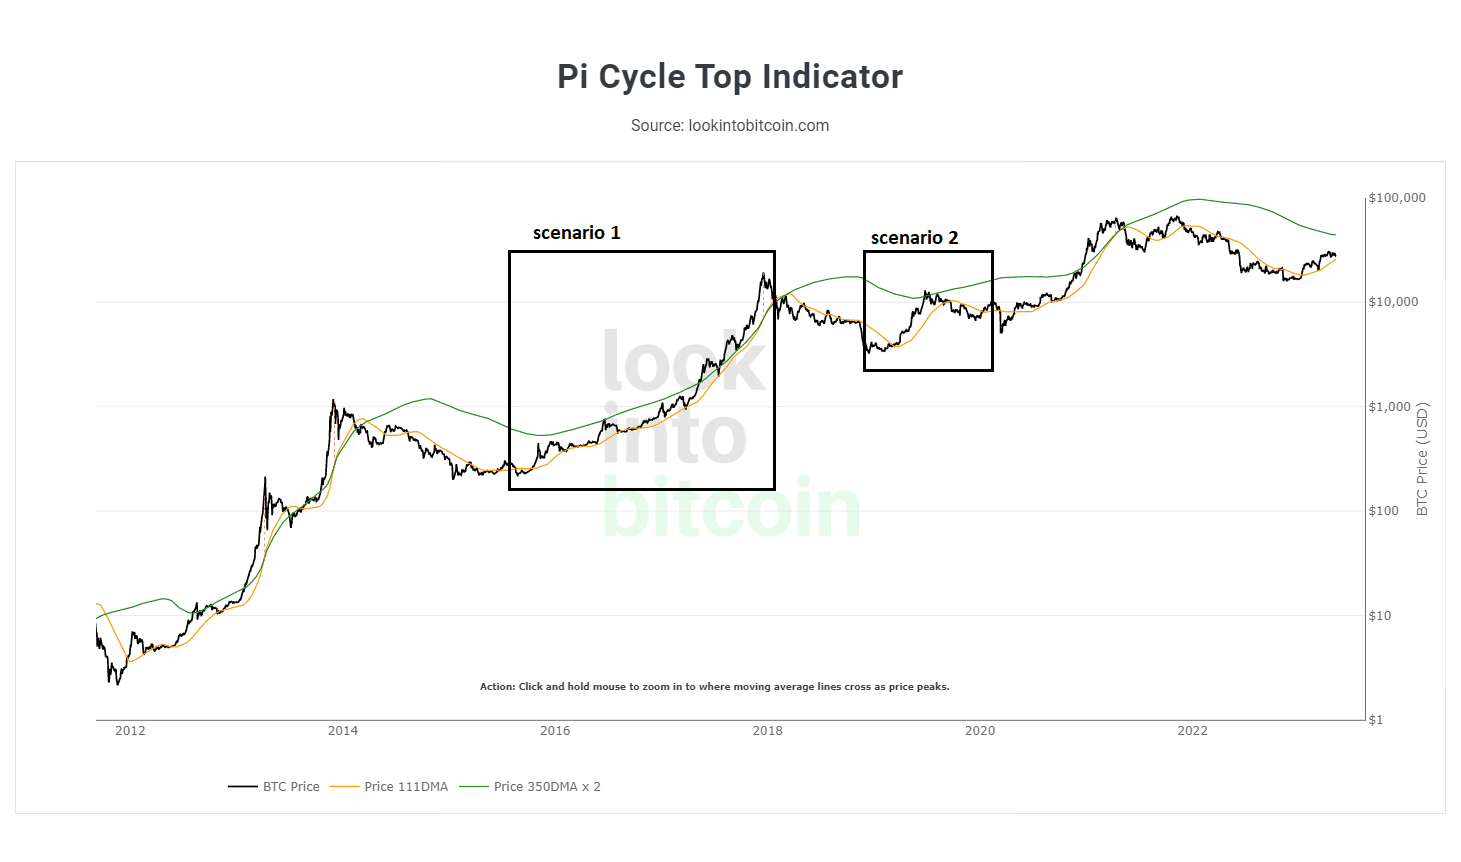
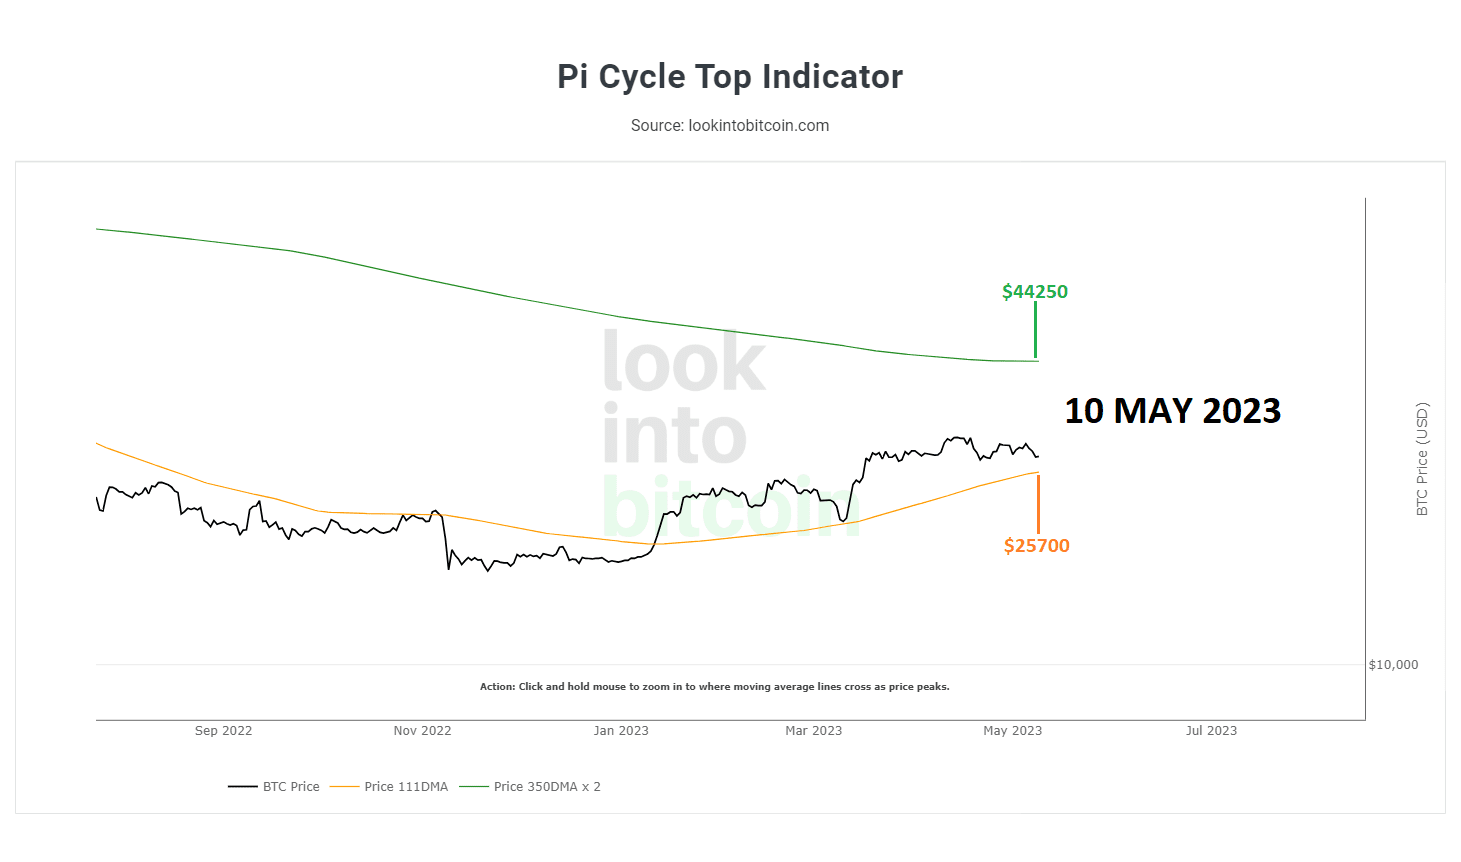
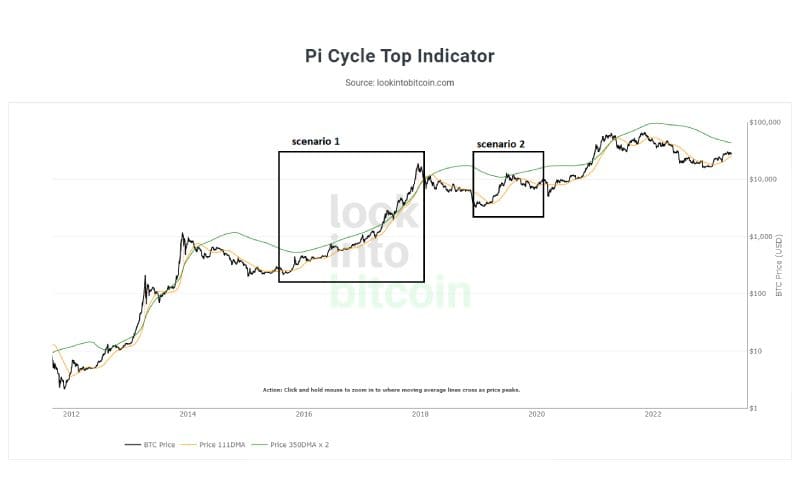
Pi Cycle Top Indicator verisine göre, $25700-$25800 (turuncu banttan) bölgesinden bitcoin güçlü bir tepki aldı. Turuncu bant altı günlük ya da haftalık kapanışlarda düşüş derinleşebilir. Takip ediyor olacağız.
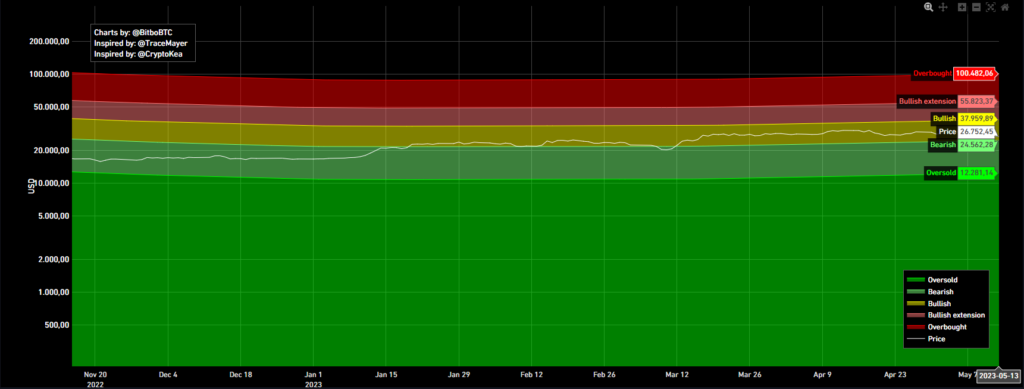
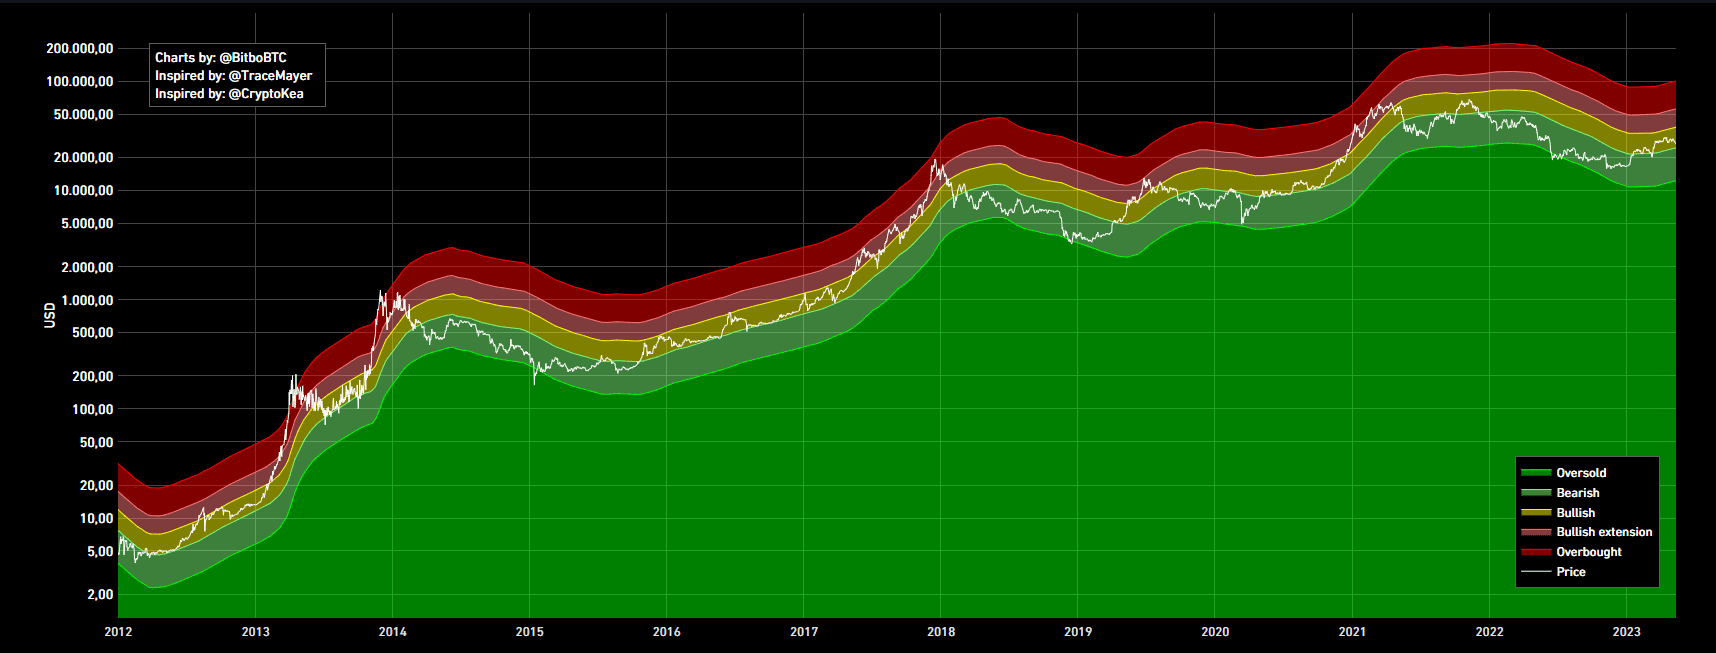
Bitcoinin bullish yapısını koruması için tutunması gereken seviye $24562. Daha da sert yükselişler yapabilmesi için $37960 seviyesini aşması beklenir. Tekrar derin bir ayı sezonu yaşanması durumunda izleyeceğimiz destek seviyesi $12281.
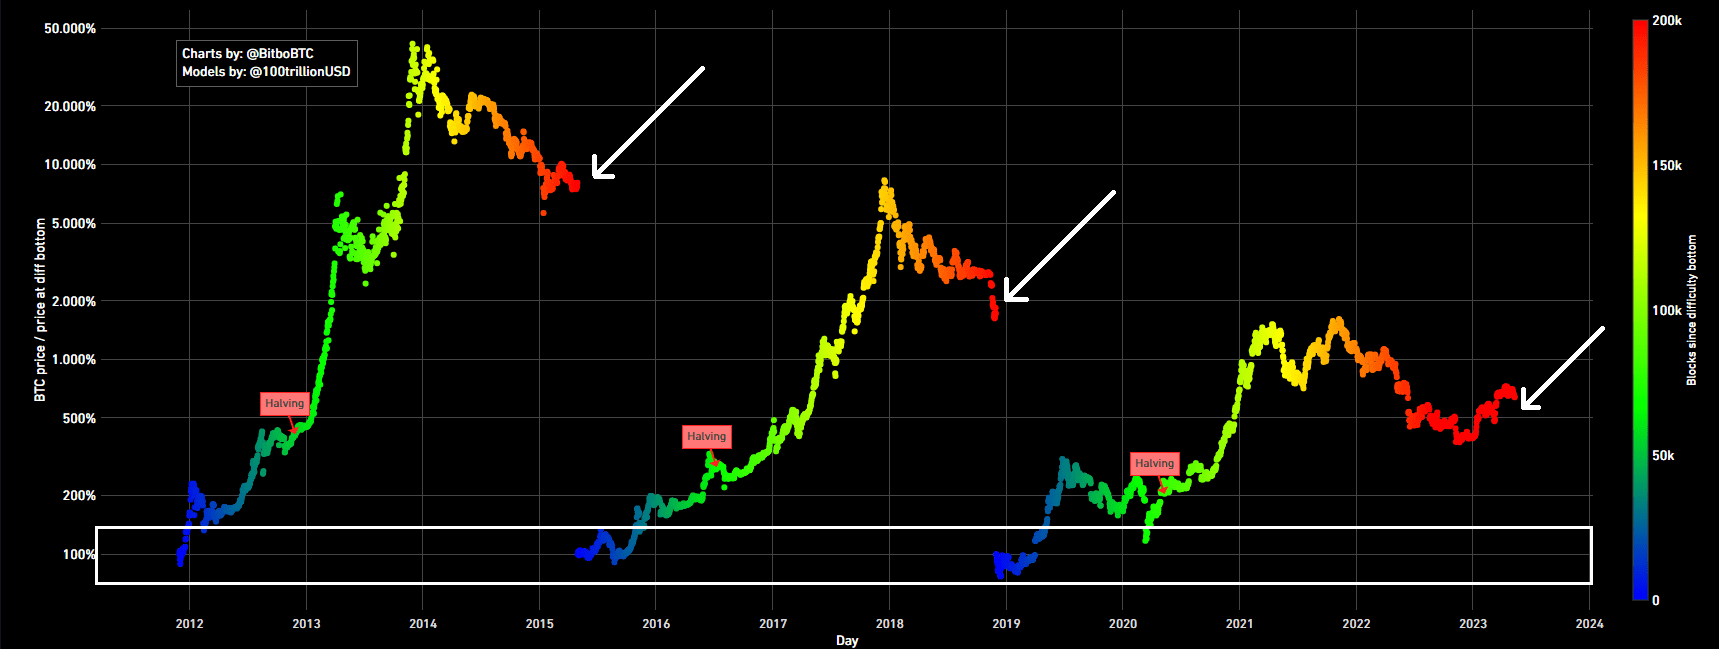
Bitcoin’de, madenciler için karlılık, Bitcoin fiyatının ve madencinin madencilik için elektrik satın alma maliyetinin bir fonksiyonudur. Bazı madenciler boğa piyasasında satmak ve çok daha fazla kar etmek için ya da ayı sezonunda ayakta kalabilmek için ellerinde fazla sayıda Bitcoin tutarlar. Ancak bir düşüş (ayı) senaryosunda, fazla kazanç elde edemeyen ve ellerindeki Bitcoinleri satmak zorunda kalan madenciler, madencilik faaliyetlerini durdurmak zorunda kalırlar. Elinde Bitcoin tutan madenciler, diğer madencileri ağdan çıkmaya zorlamak için ellerindeki Bitcoin’leri zararına da olsa satmak isteyebilirler. Ancak bu Bitcoin’de “ölüm sarmalı” denilen olaya yol açabilir. Ölüm sarmalı da fiyatın istikrarlı şekilde sürekli düşüş göstermesidir. Elbet fiyat bir noktada yukarı yönlü dönüş sağlar ancak bu süreçte birçok madenci kazım yapmayı durdurur.
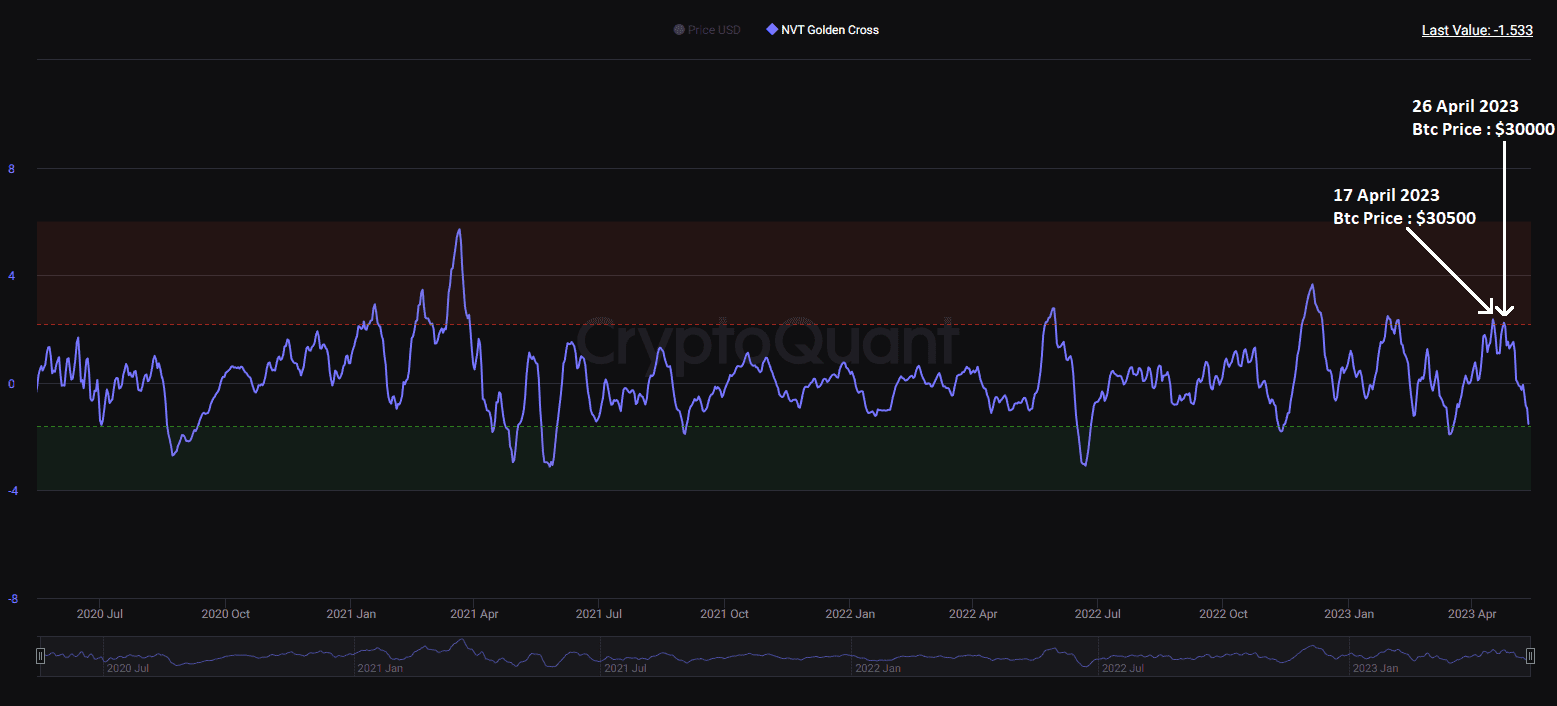
NVT Golden Cross verisi, Nisan sonundaki seviyelerinden düşüş yaşayarak ana destek bölgesine gelmiş görünüyor. Buradaki kalıcılığına bağlı olarak alım yapmak için takip edilebilir bir veri.
Onchain verileri ve açıklamalarına buradan göz atabilirsiniz.
Onchain analiz, blockchain piyasalarından elde edilen verilerden oluşur ve sadece borsalara giriş ve çıkışları yansıtır. Bu veriler olumlu veya olumsuz şekilde yorumlanabilir, ancak boğa veya ayı piyasasıyla ilgili kesin bir öngörü içermez. Yukarıda paylaşılan tüm analizler eğitim amaçlıdır, bu gönderi herhangi bir finansal tavsiye içermez.