


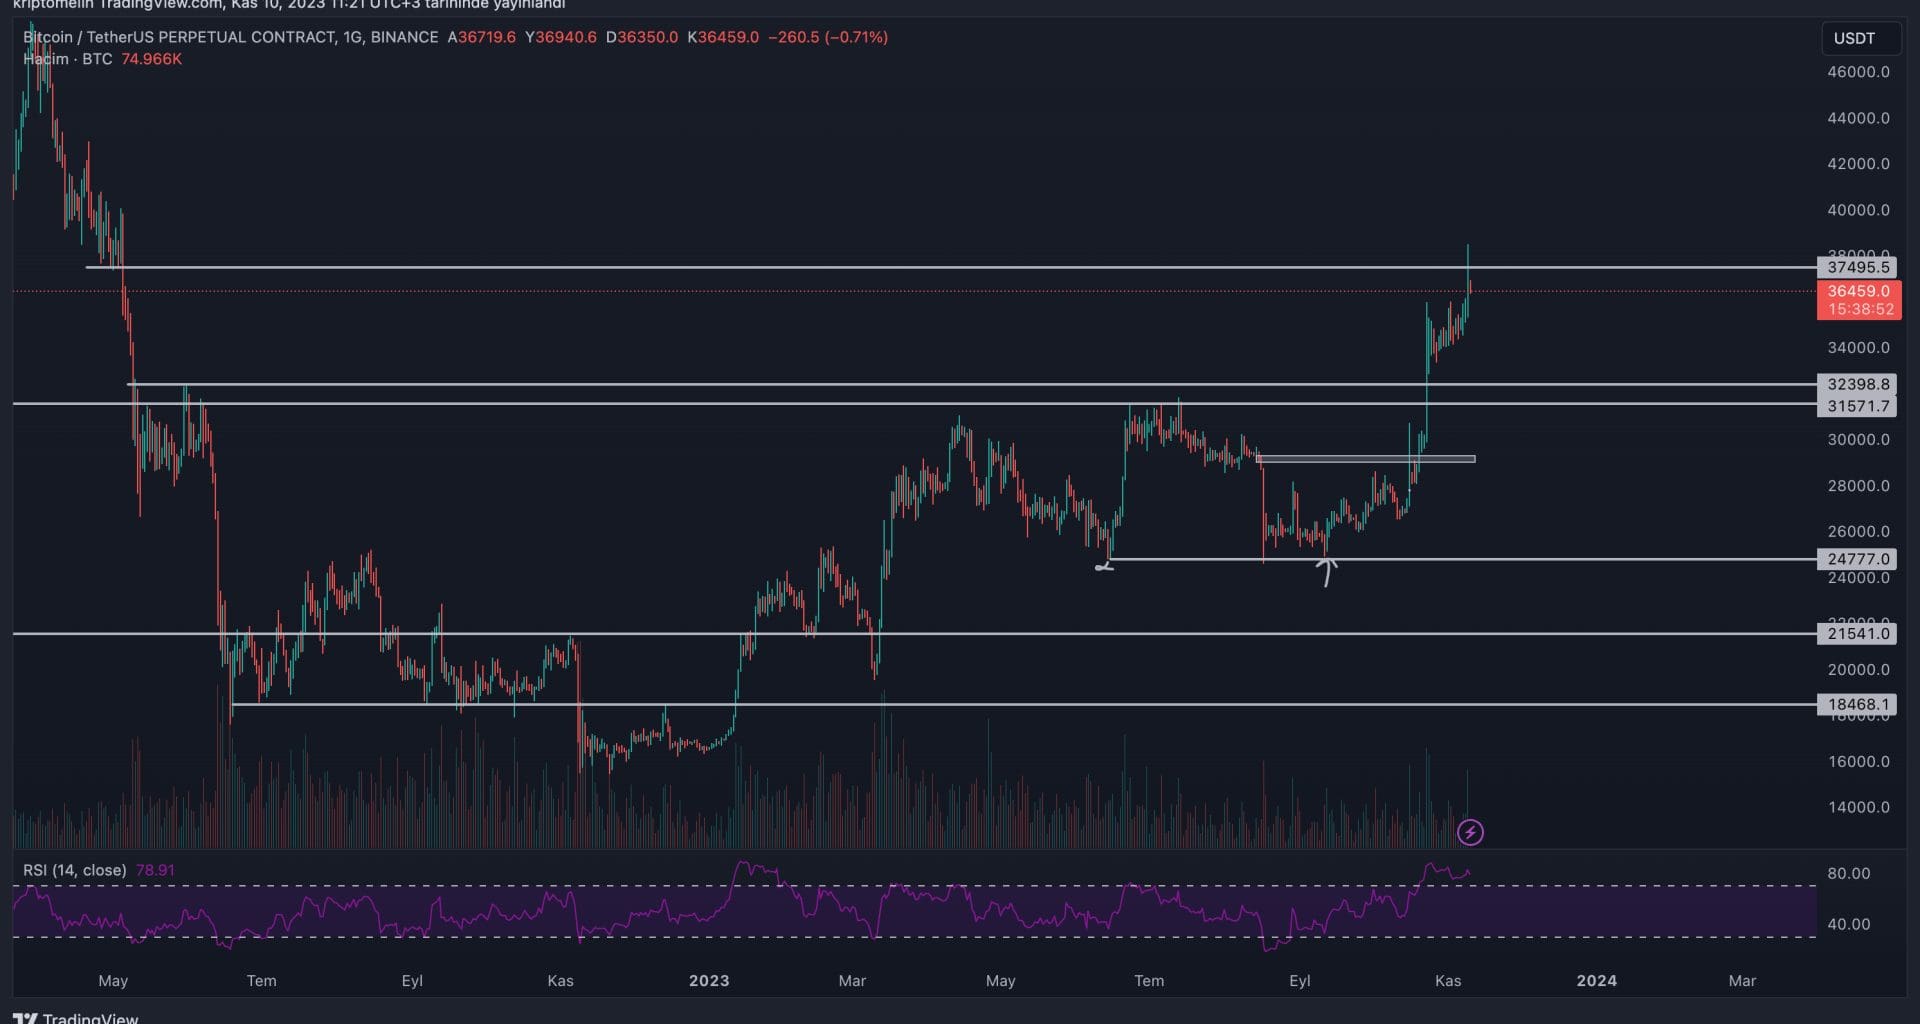
Bitcoin, ETF beklenti haberleri ile beraber dün daha önce sıklıkla bahsetmeye çalıştığımız 37.500$ direncini test etti. Bu bölgeye günlükte baktığımızda önemli bir direnç seviyesi ve genel olarak margin işlem yapanlar için shortların fazla açıldığı bir bölge oldu ve fiyat açılan short işlemleride silkeleyerek 38.300$ seviyesine kadar yükseliş gerçekleştirdi.

Grafiği günlük olarak incelediğimizde 37.500$ seviyesinin üzerine atılan bu fitili likidite temizliği olarak yorumlayabiliriz. Grafiği genel görünüme bakarak yorumlamak gerekirse direnç bölgesini test etmiş olması ve bu alandan tepki almış olmasından dolayı test edilmemiş olan 31.500$-32.400$ desteğinin test edilmesi beklenebilir.
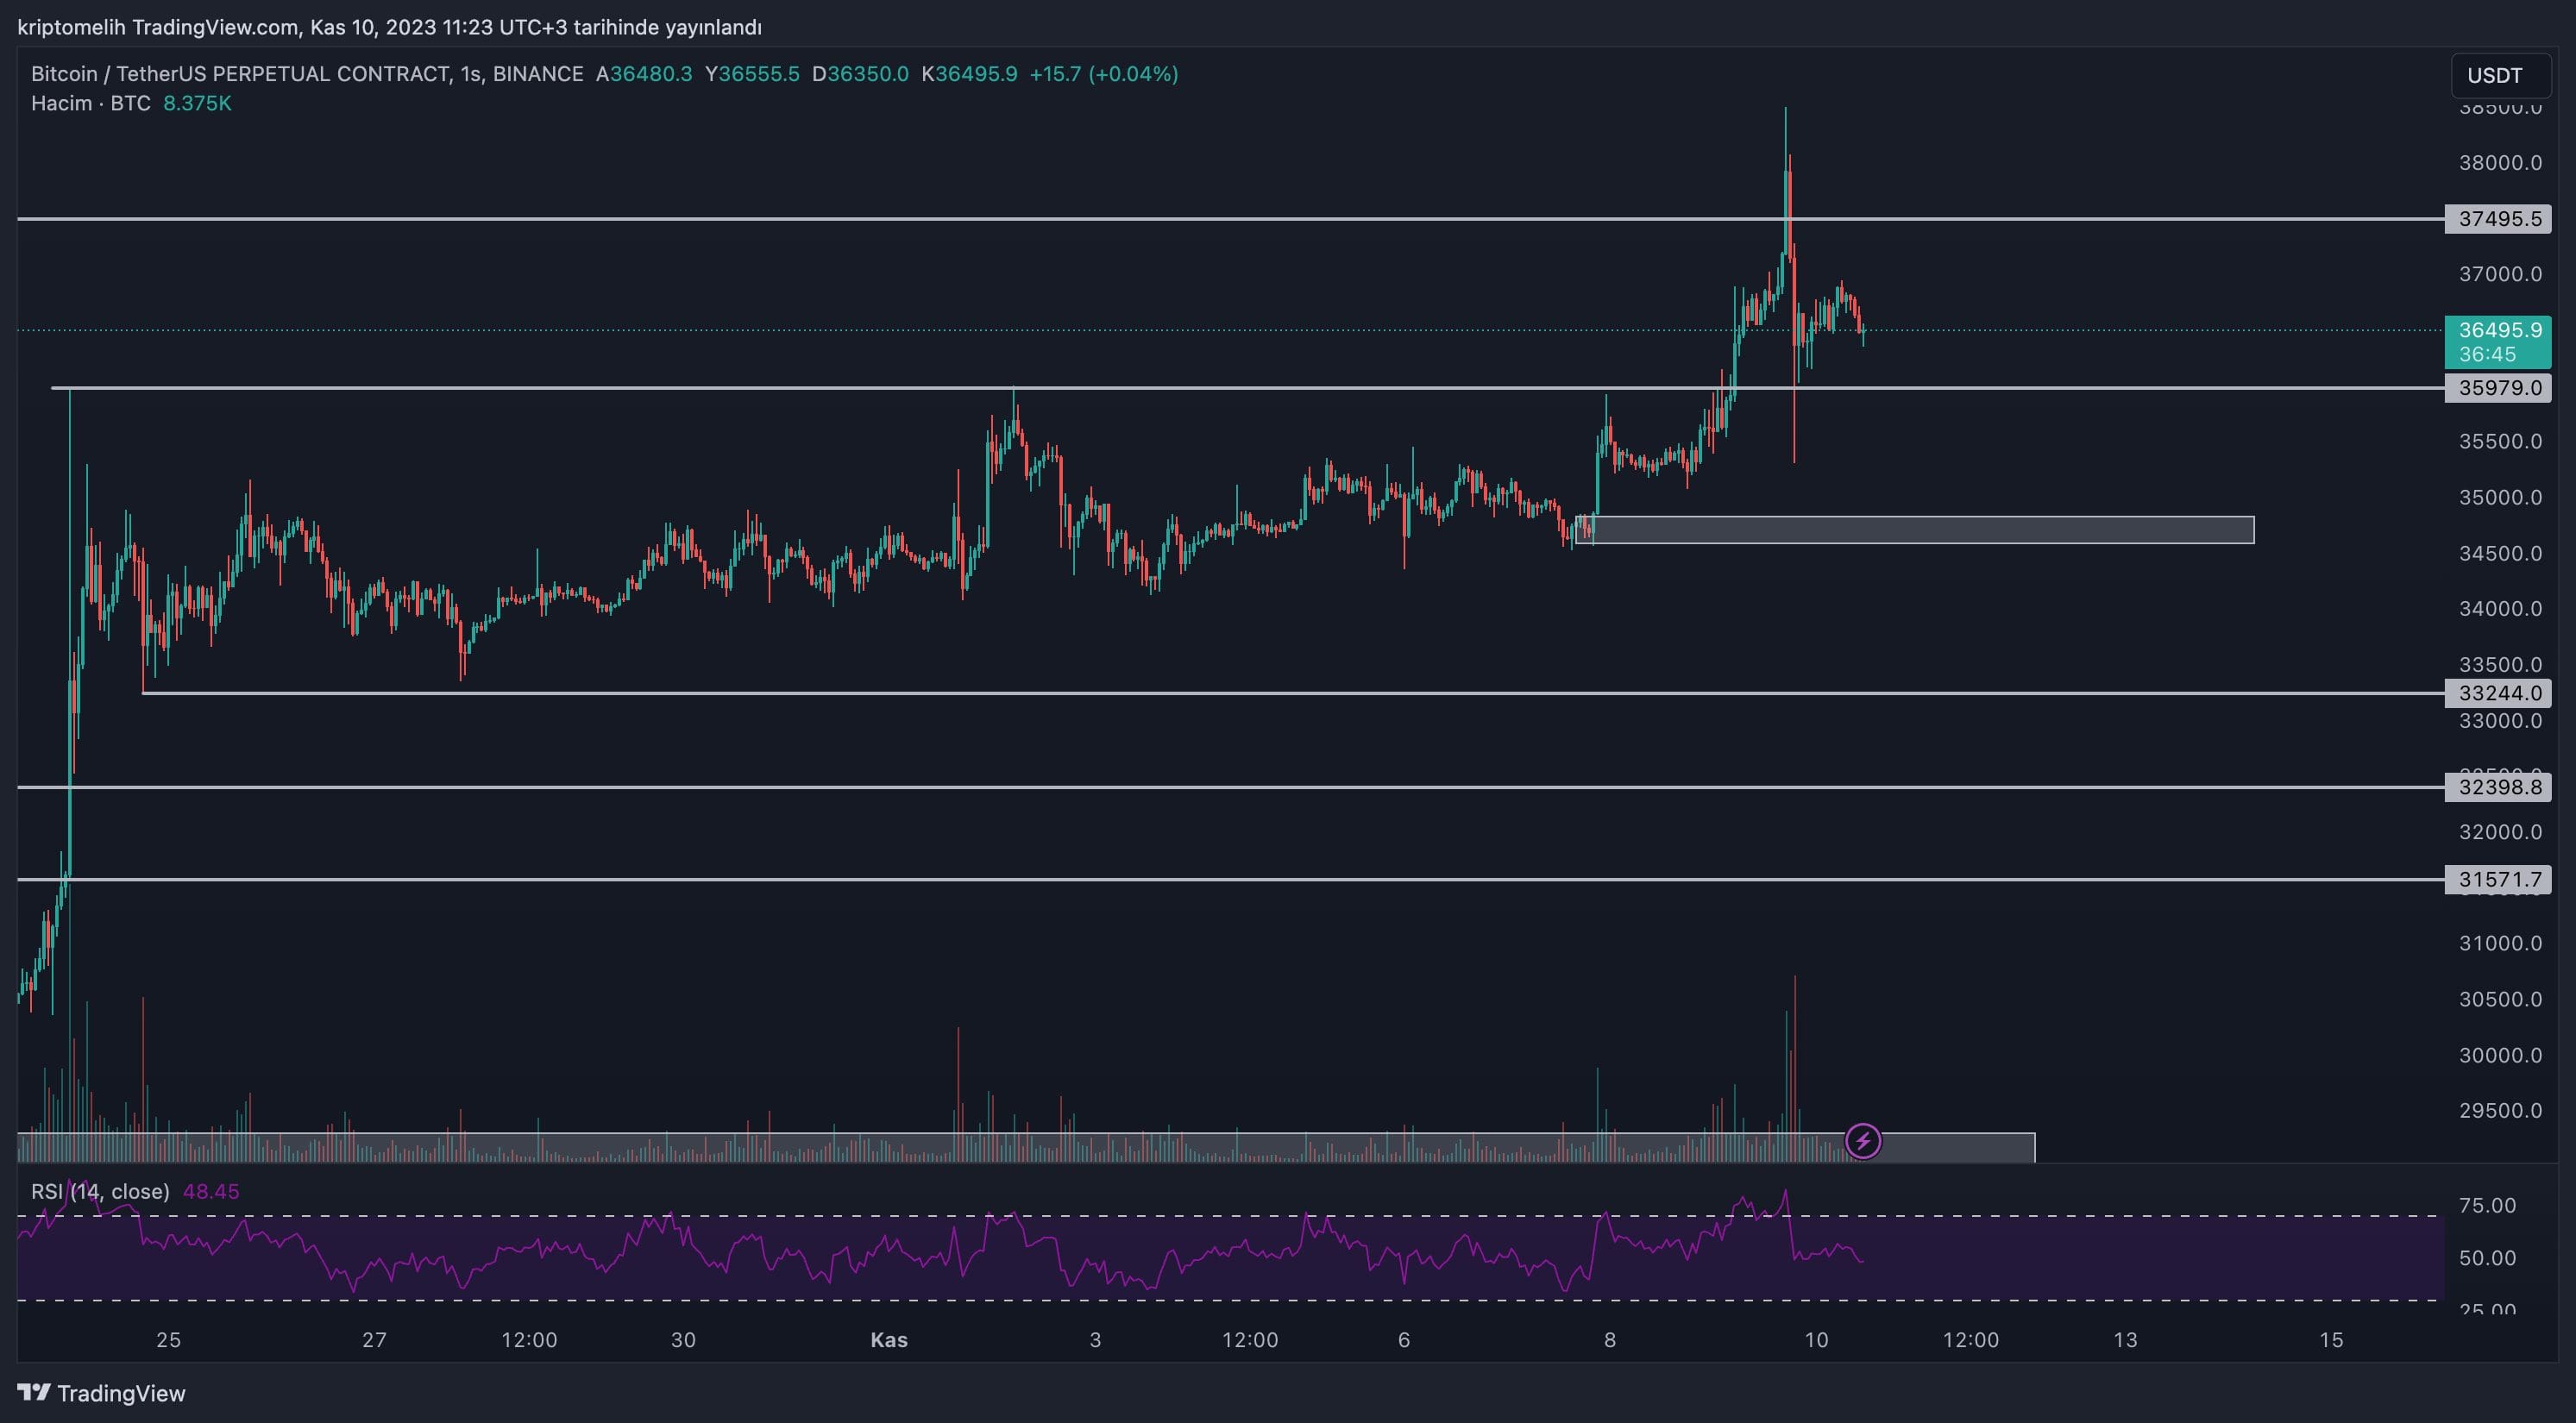
Daha kısa zaman diliminde incelediğimizde ilk destek bölgesi olarak 36.000$ seviyesi fiyatı tutmasını bekleyeceğimiz ilk destek bölgesidir. Bu alanın kaybedilmesi durumunda bir alt destek bölgesi olarak 34.800$-34.600$ seviyesinin tepki alması muhtemel bir bölge olduğunu düşünüyorum. Bu seviye hem direnci kırdırıp yeni bir High yaptıran “Order Block” seviyesi hem de “Imbalance” bulunduğu için fiyatın bu alandan tepki alması beklenebilir.
Fiyat kısa zaman diliminde scalp olarak bu seviyelerden tepki alabilecek olsa da genel görünüme baktığımızda fiyatın test edilmemiş olan günlükteki destek bölgesini test etmek isteyebileceğini göz önünde bulundurarak, pozisyon almadan önce mutlaka risk analizi yapılmasının önemli olacaktır.