


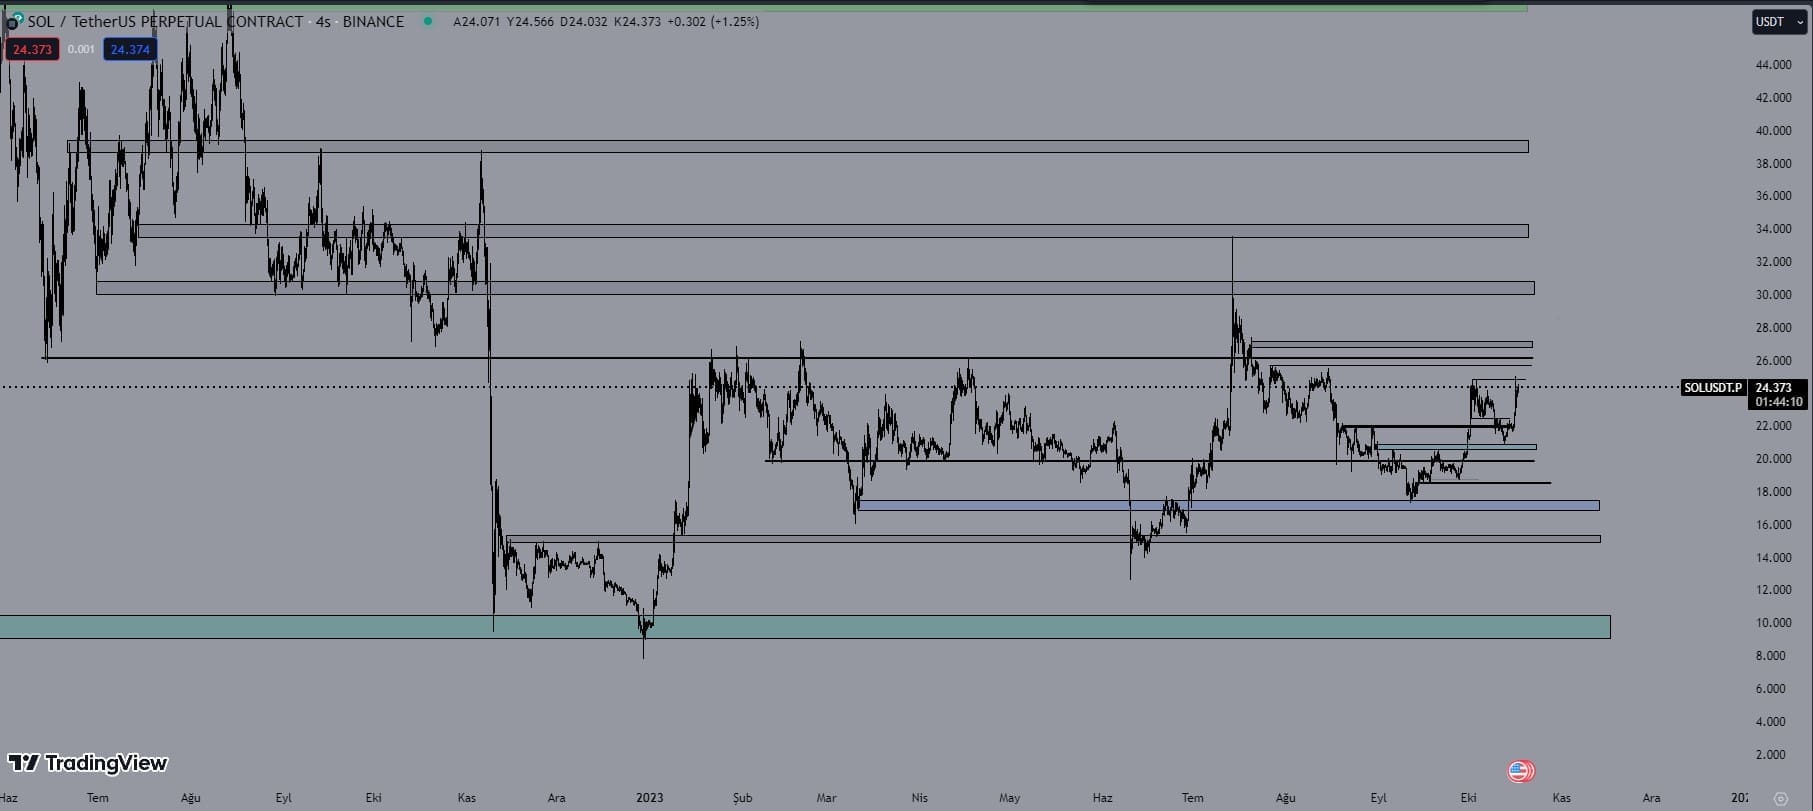
Geçtiğimiz haftalarda paylaştığım Solana analizimde belirttiğim destek seviyelerinin çalıştığını görüyoruz. 20.88$ seviyesinden marketin yürümesiyle beraber %18 lik bir yükseliş gerçekleştirdi.
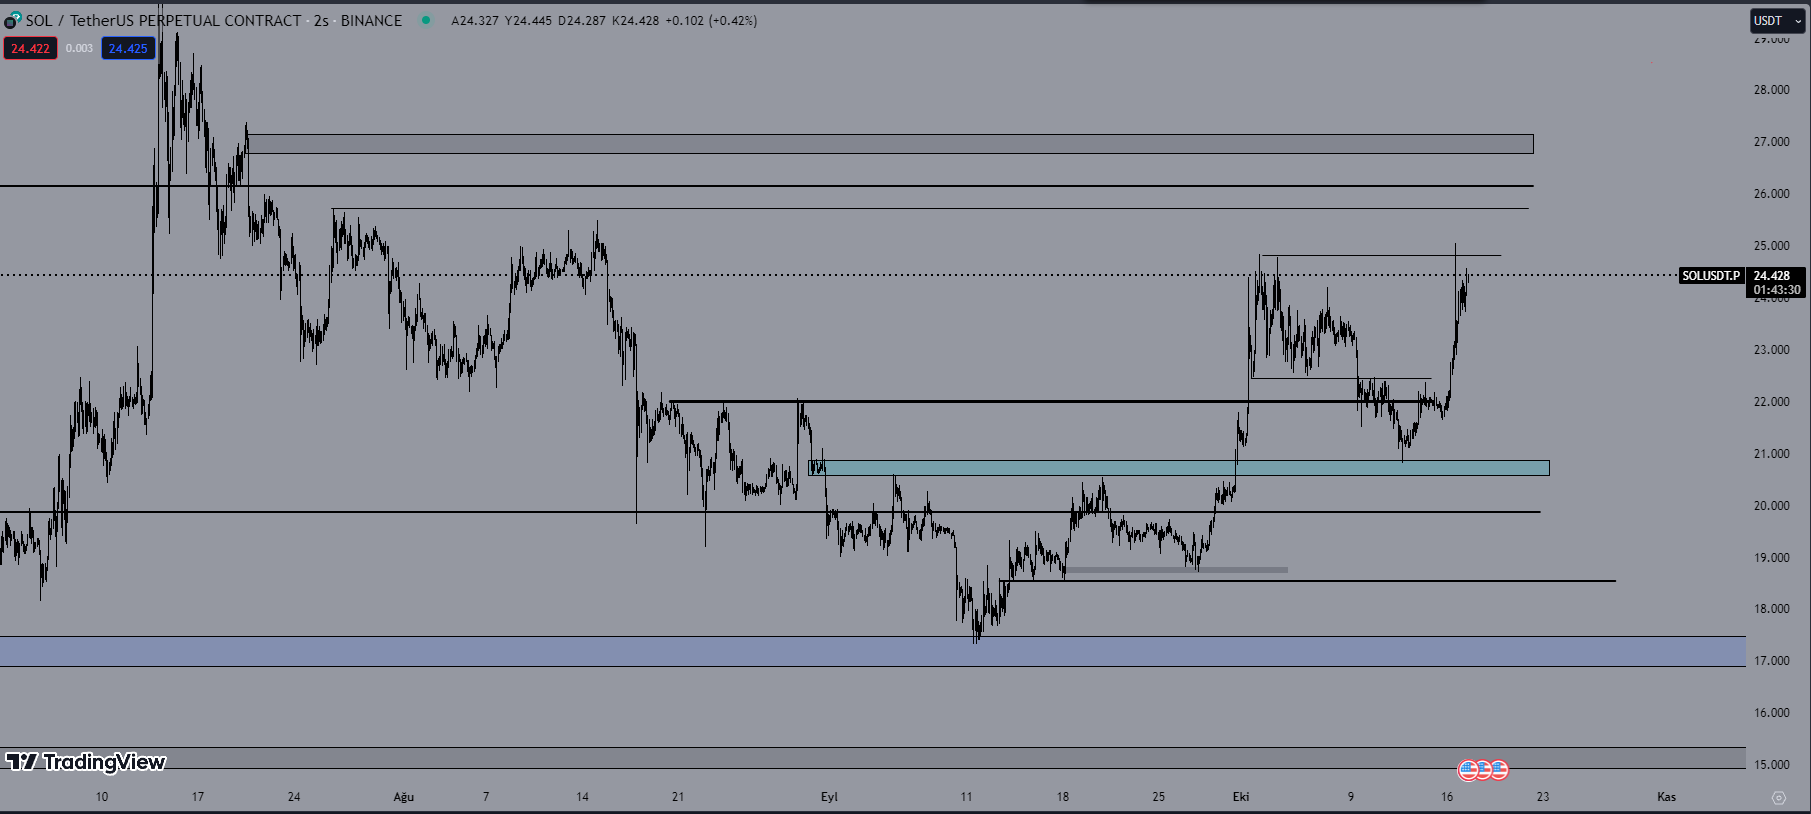
24.82$ seviyesinde ki likiditeleri fiyat temizledi. Markette ki ETF haberinin yalanlanması ardından markette geri çekilmeler görsekte Solana bu geri çekilmeden çok etkilenmedi. Fiyatın güçlü durduğunu görebiliyoruz. Bu noktada takip edeceğim ilk direnç seviyesi 25.727$- 26.100$ seviyeleri. Bu bölgede fiyatın zayıflık göstermesi durumunda 26.882$-27.1$ aralığına bir fitil bekleyip bu bölgeden 22.25$ hedefli short işlem denemeleri yapılabilir. Fakat bu seviye üzerinde kalıcılık sağlaması durumunda fiyatın 30$ seviyesini test etmek isteyebilir. Takip ettiğim ilk destek seviyesi ise 22.45$-22.10$ aralığıdır.
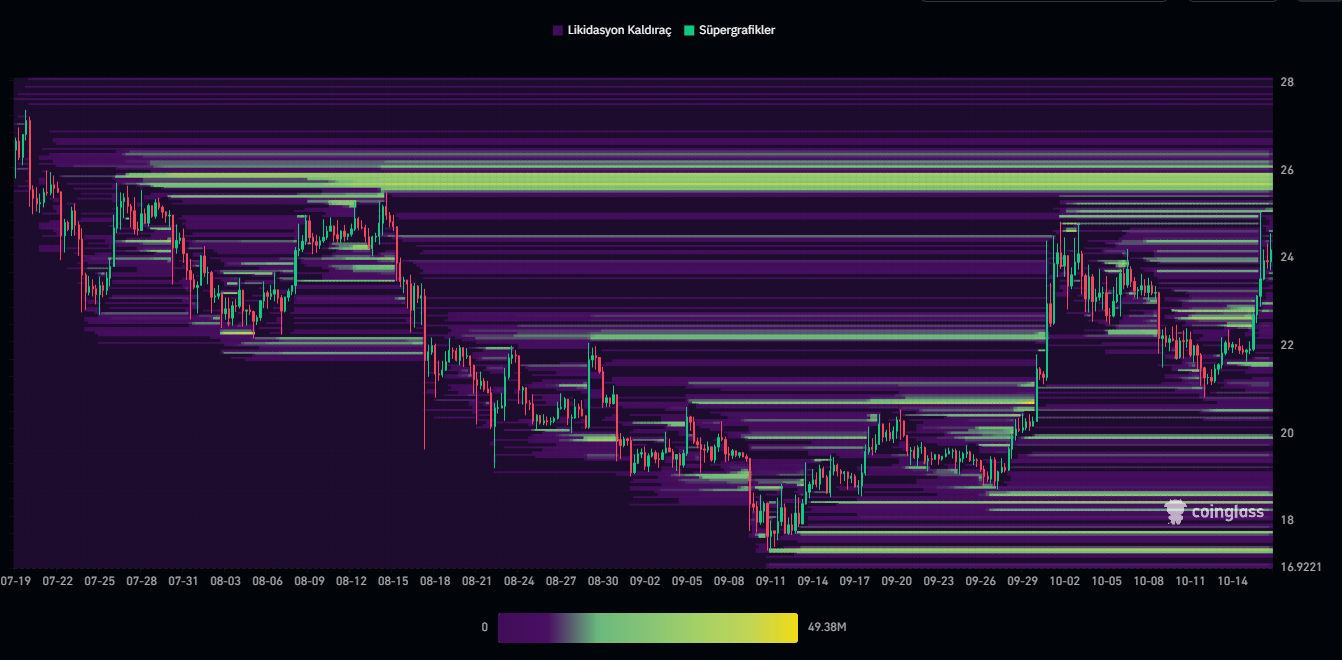
Likidasyon haritasına baktığımız zaman 26$ seviyelerinde ciddi likiditeler olduğunu görüyoruz.
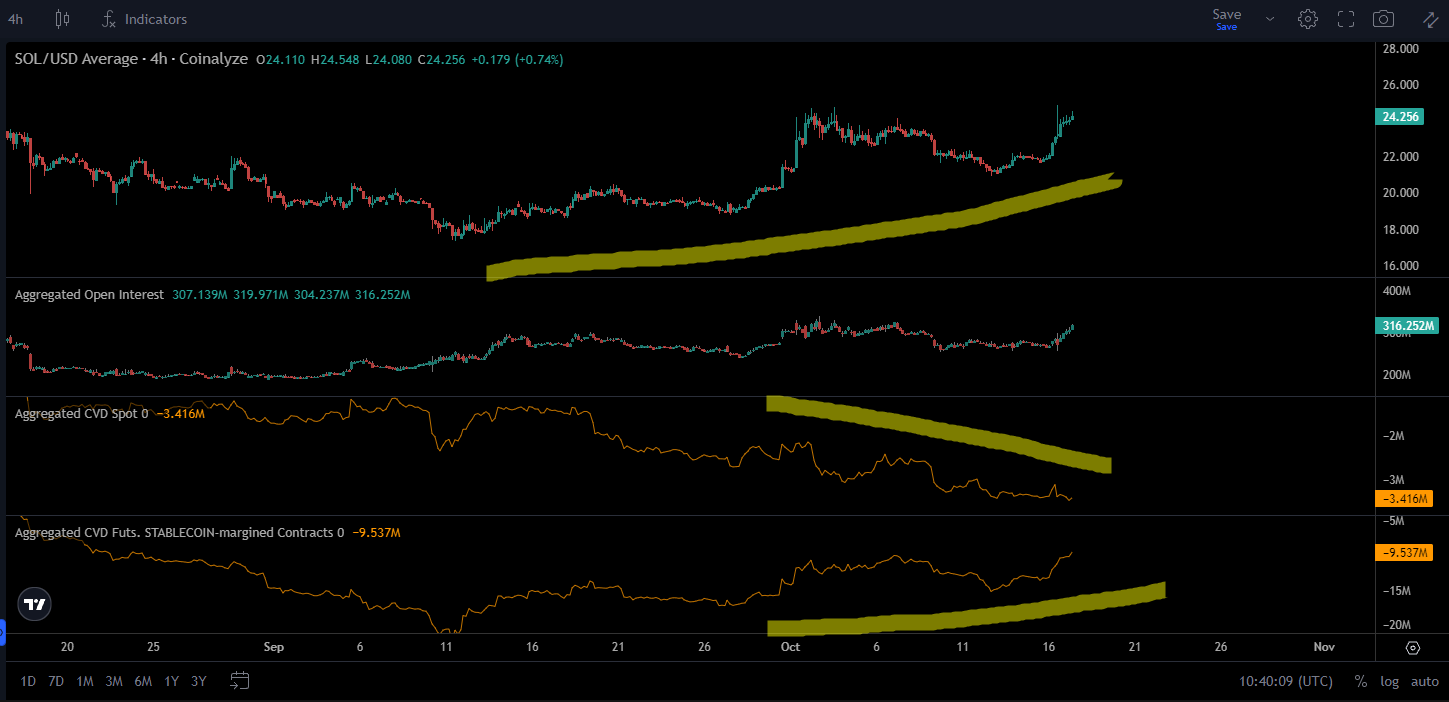
Bu görseli incelediğimizde ise fiyatın spot tarafından değil de marjin tarafından açılan işlemler ile birlikte yükseldiği yorumunu yapabiliriz.
Burada paylaşılan analizler yatırım tavsiyesi olmamakla beraber, piyasada kısa-orta vade işlem fırsatı verebileceğini düşünülen destek direnç seviyeleridir. İşlem alma ve risk yönetimi sorumluluğu kullanıcının kendisine aittir. Paylaşılan işlemlerde stop loss kullanmanız şiddetle tavsiye edilir.