


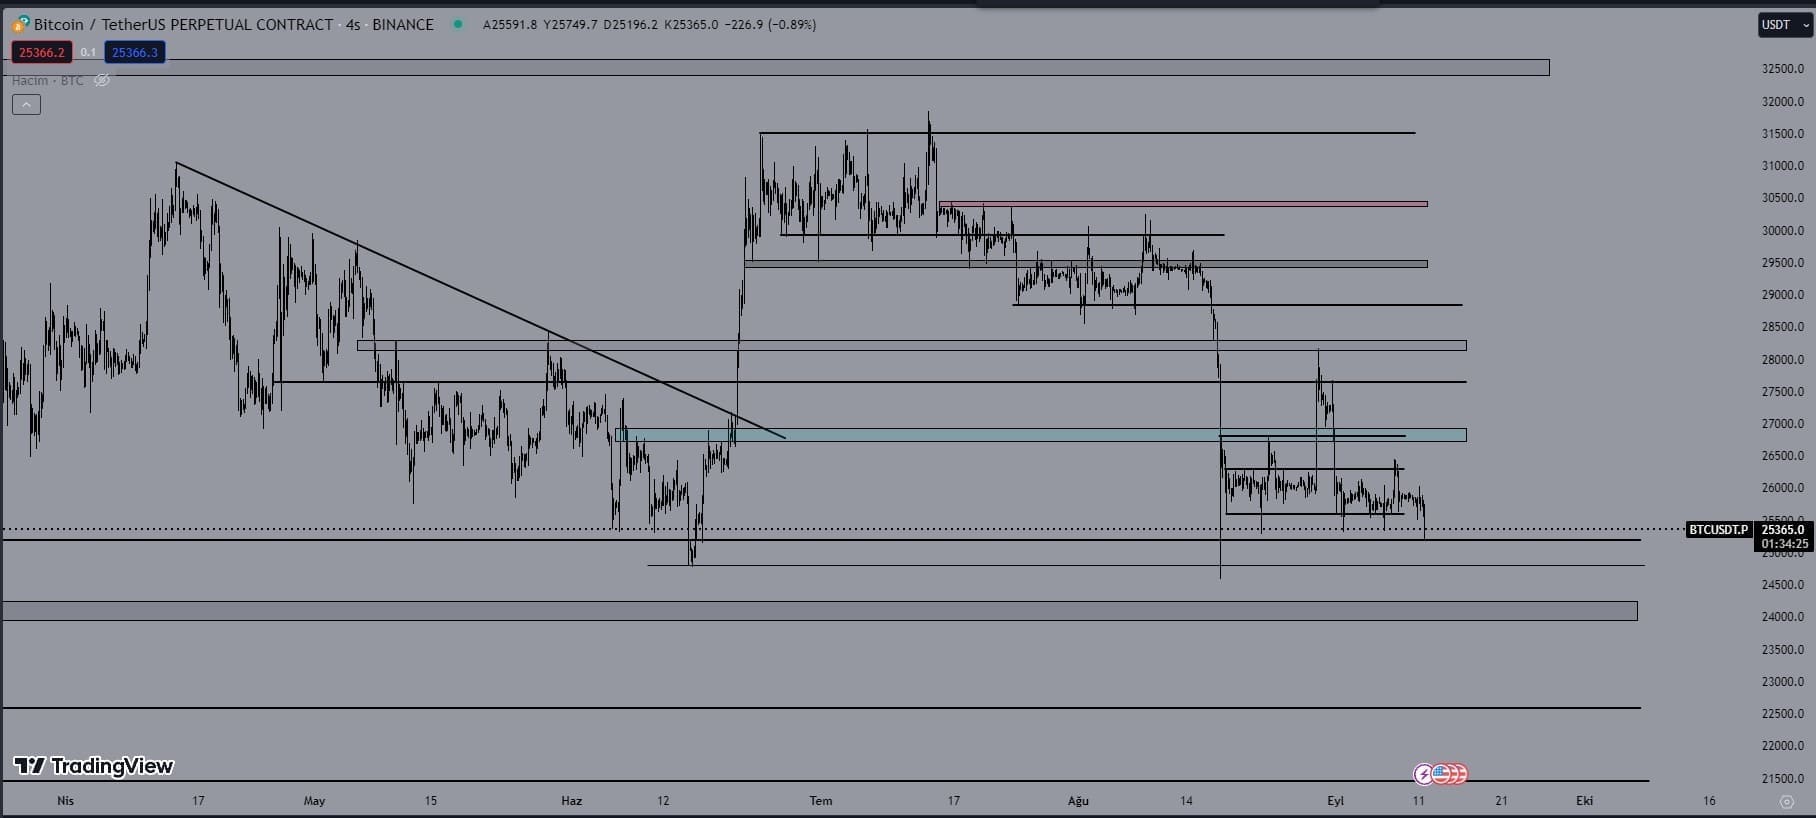
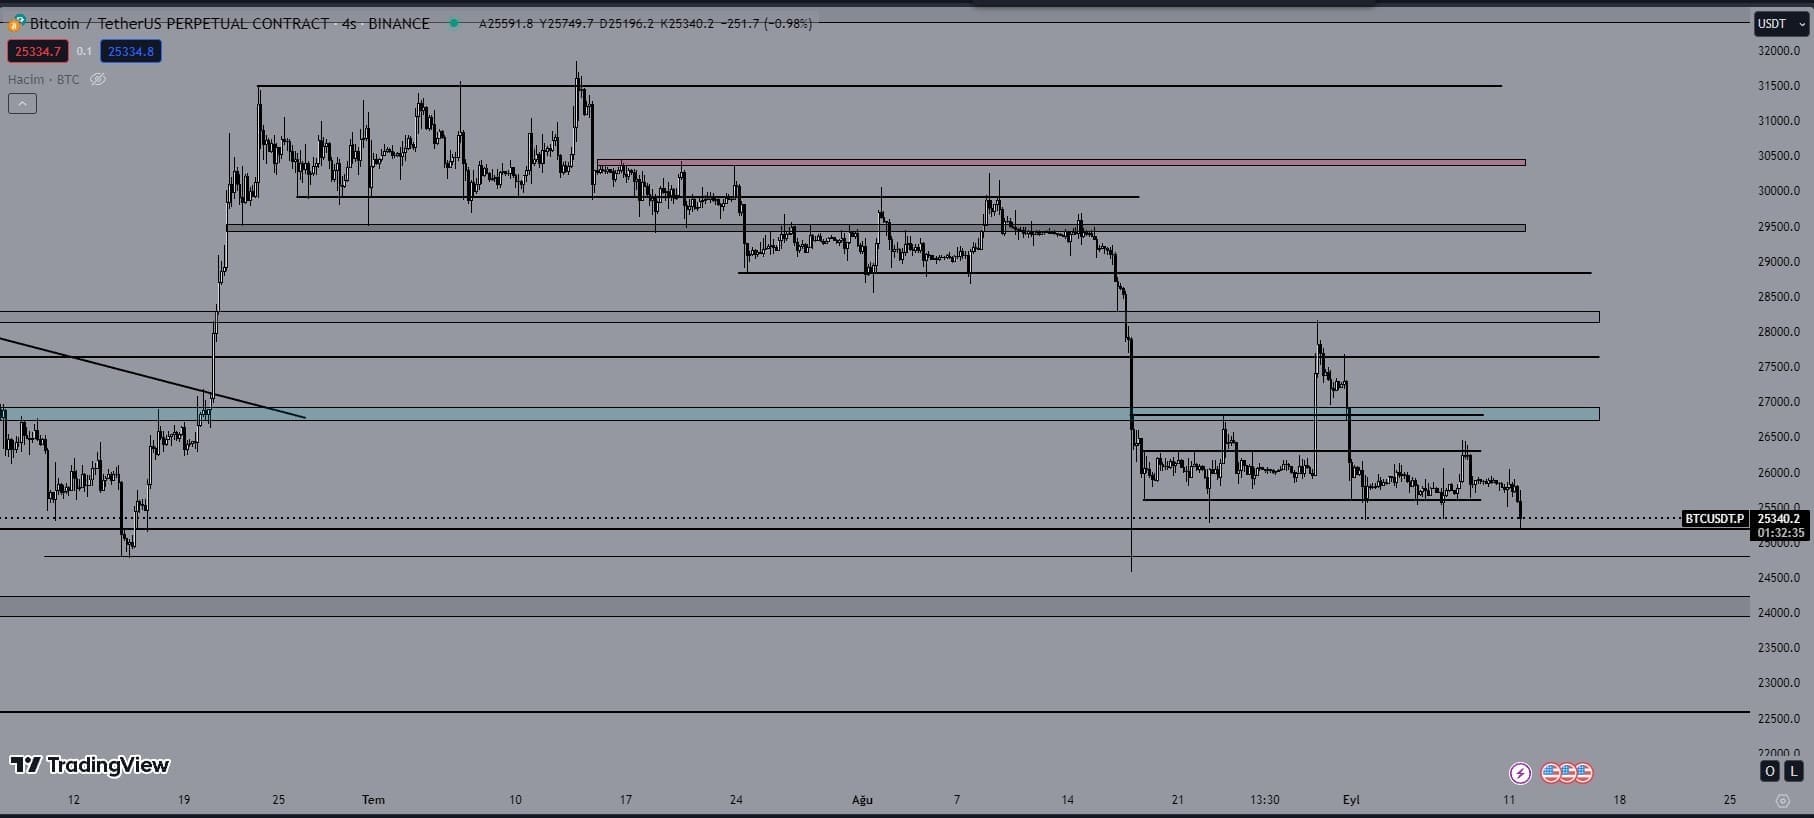
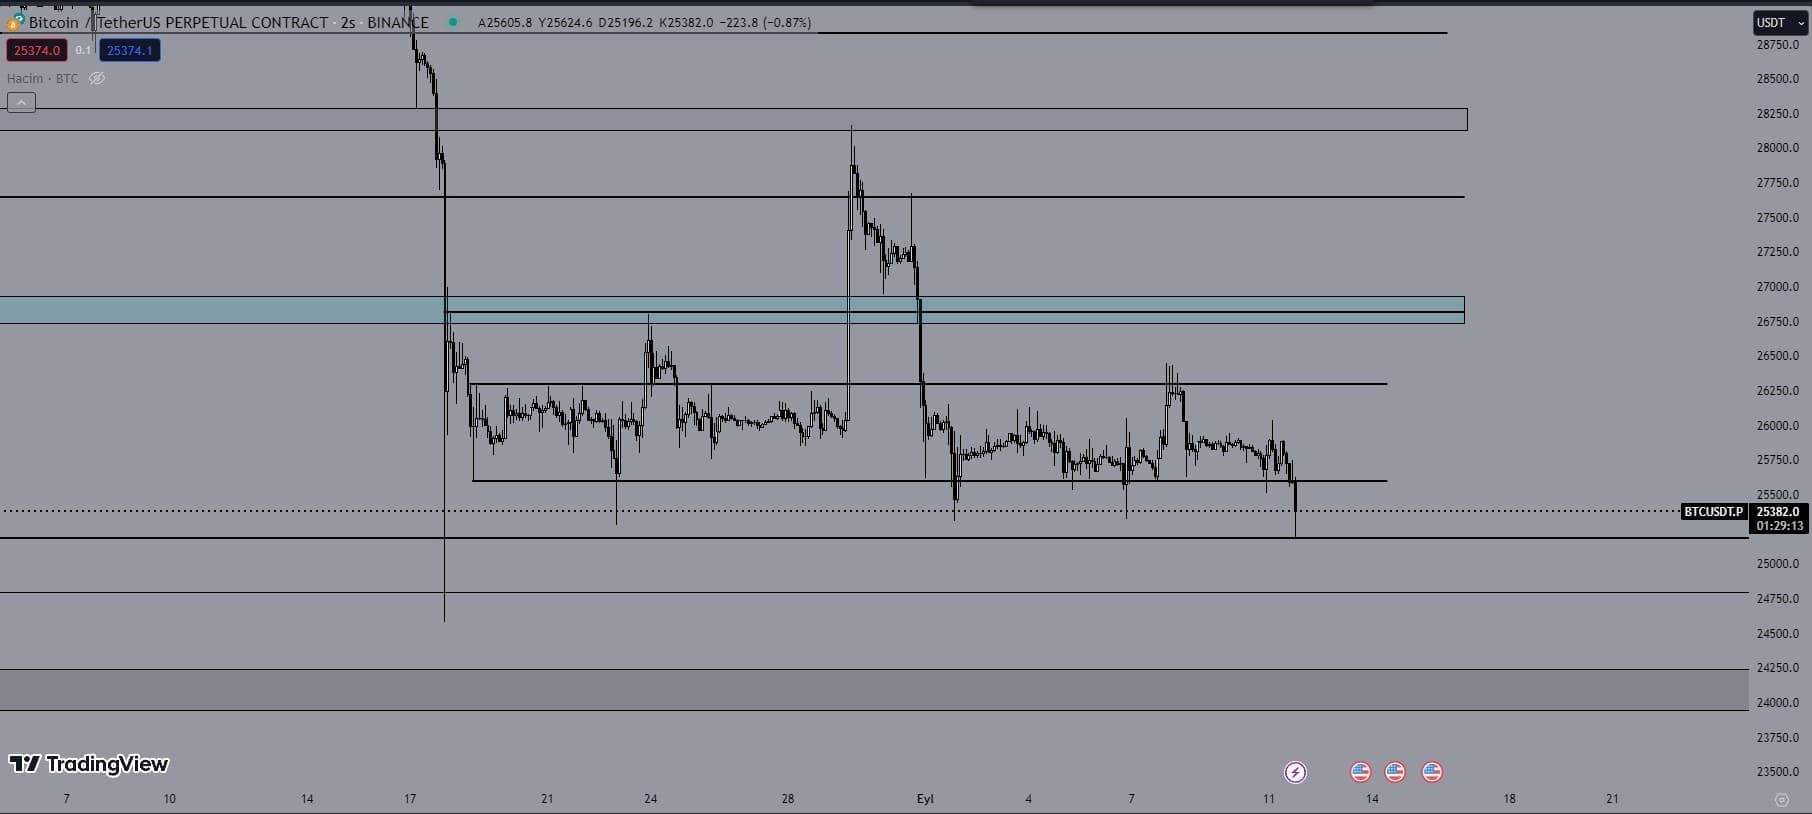
Uzun süredir yatay hareket eden BTC, 25000$-25200$ desteğinde tutunmaya çalışıyor. Eğer fitil olarak kalıp tekrardan destek üstünde kapanış yaparsa, likidite temizliği diyebiliriz. Bu senaryoda 26800$ seviyesinin test edilmesini beklerim. Şuan için bulunduğu destek bölgesi 25200$ seviyesi BTC için kilit bir seviye. Bu bölgenin altında gelen günlük kapanışlar, bize alıcıların bu destek seviyesinde azaldığını gösterir, fiyat aşağıda ki destek bölgelerini test etmek ister. Takip ettiğim destek seviyeleri 24800$ ve 24100$ seviyeleri. Takip ettiğim direnç seviyeleri ise 26300$ ve 26800$ seviyeleri.
USDT.D
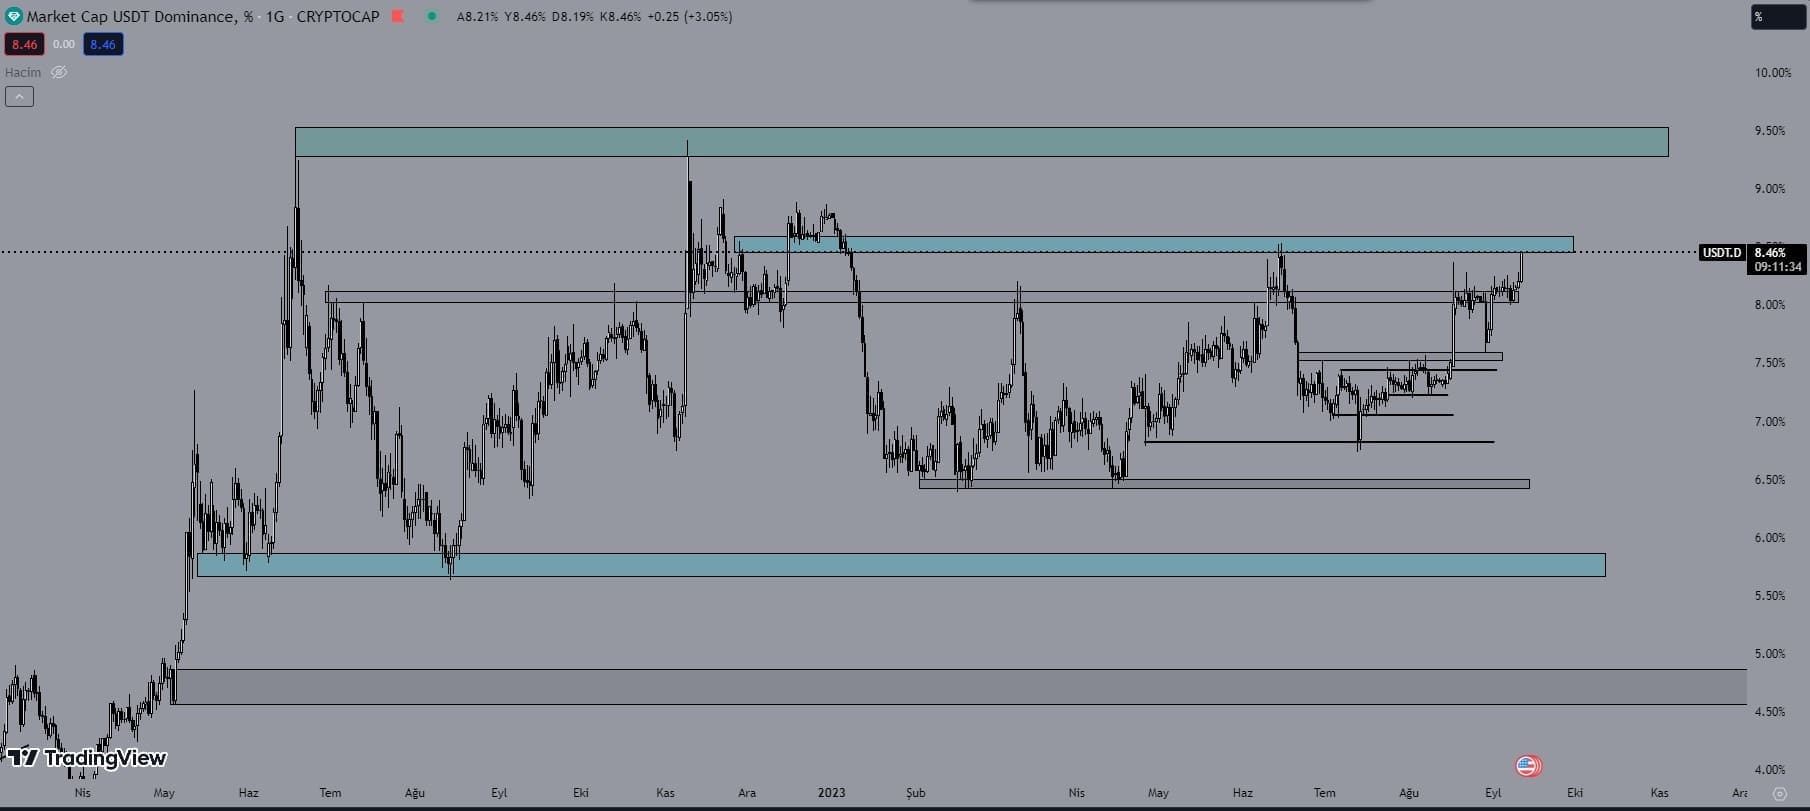
Tether dominance grafiği ara direnç bölgesinde, 8.50% seviyesi üzeri kalıcılık sağlarsa ana direnç olarak takip ettiğim seviye 9.30% seviyesi. 8.50% den red yemesi durumunda tekrardan 8.05% seviyelerine bir düşüş bekleyebiliriz.
Burada paylaşılan analizler yatırım tavsiyesi olmamakla beraber, piyasada kısa-orta vade işlem fırsatı verebileceğini düşünülen destek direnç seviyeleridir. İşlem alma ve risk yönetimi sorumluluğu kullanıcının kendisine aittir. Paylaşılan işlemlerde stop loss kullanmanız şiddetle tavsiye edilir.