


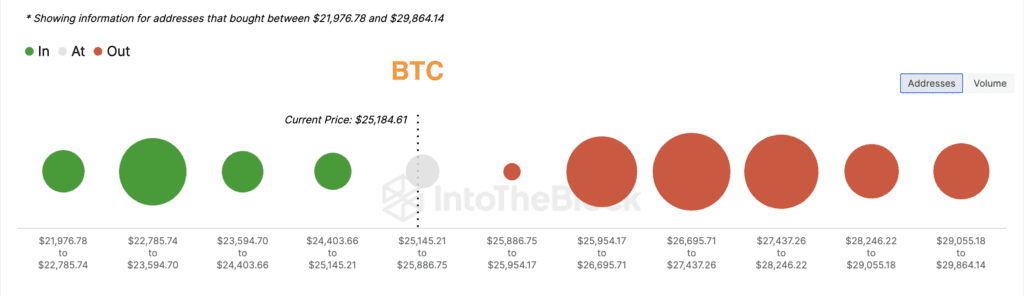
Onchain üzerinde $25955-$28250 maliyetli kullanıcılar yüksek zararda görünüyor. $23595-$25145 maliyetli kullanıcıların karı ise azalmış durumda. Kırmızı küreler ne kadar büyük , yeşil küreler ne kadar küçük ise yükseliş ihtimali o kadar yükselir. Yeşil küreler ne kadar büyük, kırmızılar küreler ne kadar küçük ise düşüş ihtimali o kadar yükselir. Kürelerin bulunduğu seviye aralıkları güçlü destek ya da güçlü direnç olarak çalışabilir. Bitcoin şu anda, kısa vadede tepki yükselişine yakın gibi görünüyor.
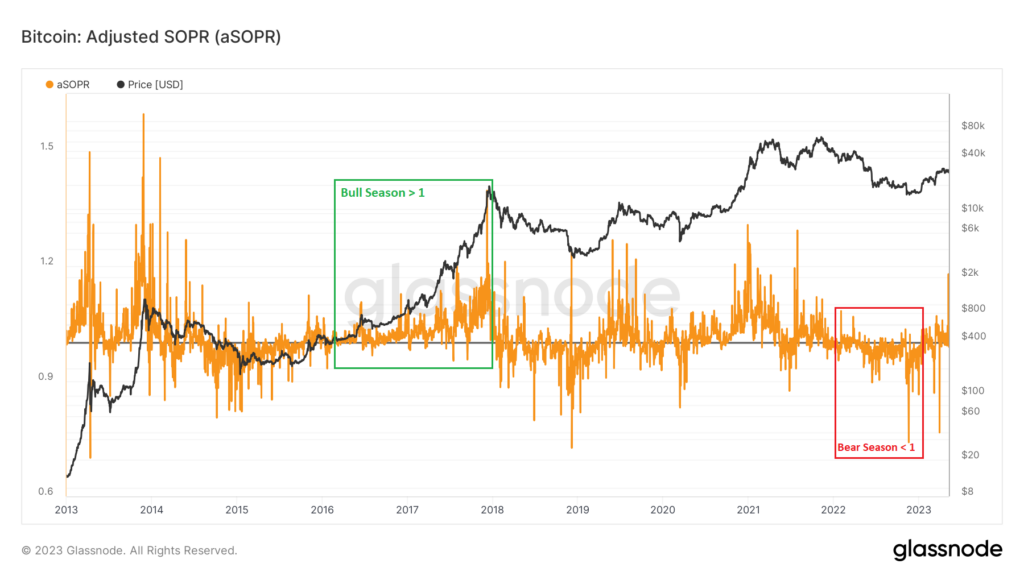
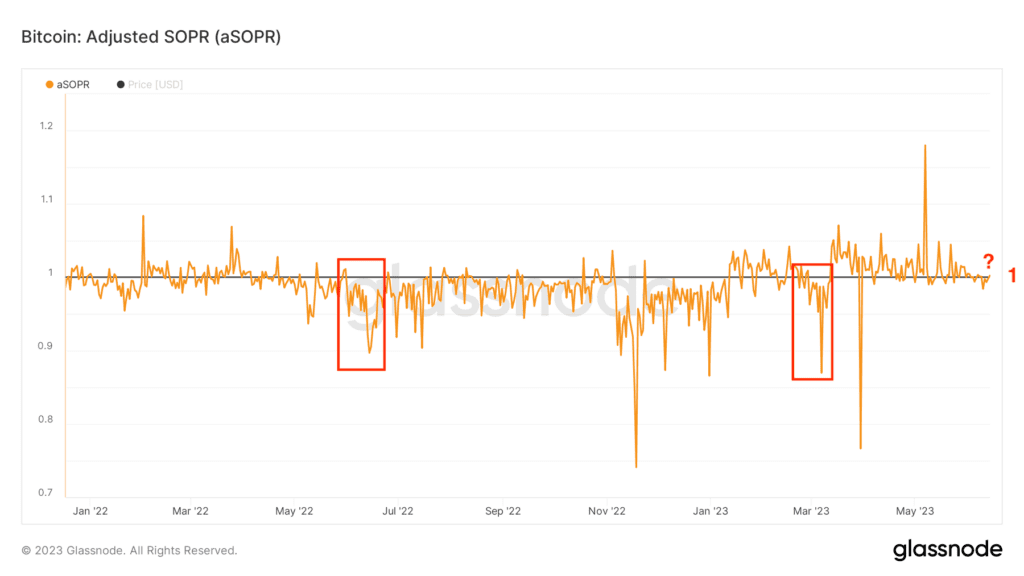
ASOPR verisi boğa sezonlarında çoğunlukla 1 seviyesi ve üzerinde, ayı sezonunda 1 seviyesi ve altında performans göstermiş. Bitcoin boğa sezonunda ise bu verinin 1 seviyesinden yukarıda tutunması gerekir. Şu anki görünüm tehlikeli görünüyor çünkü geçmişte bu tür görünümlerden sonra büyük düşüşler yaşandı.
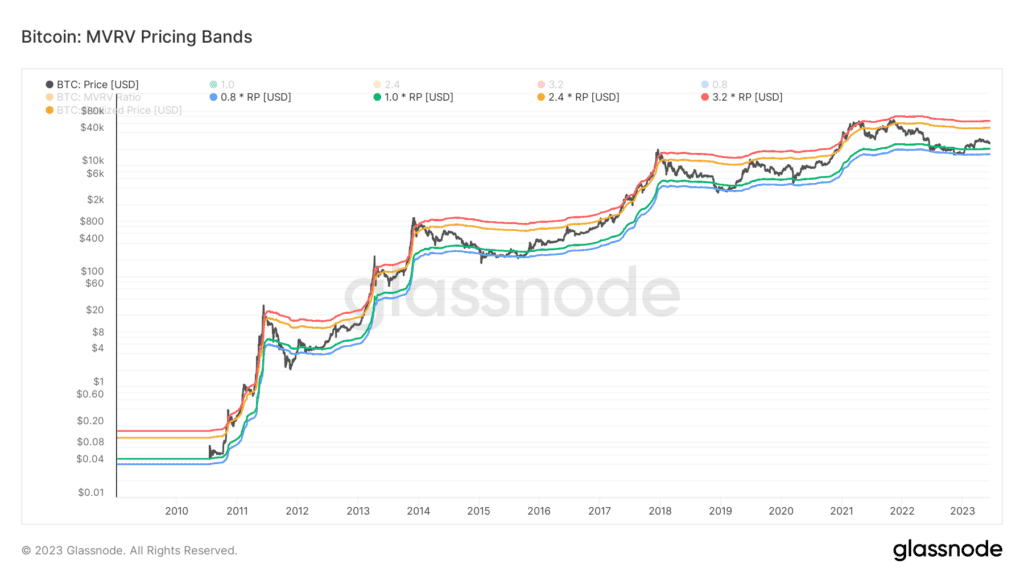
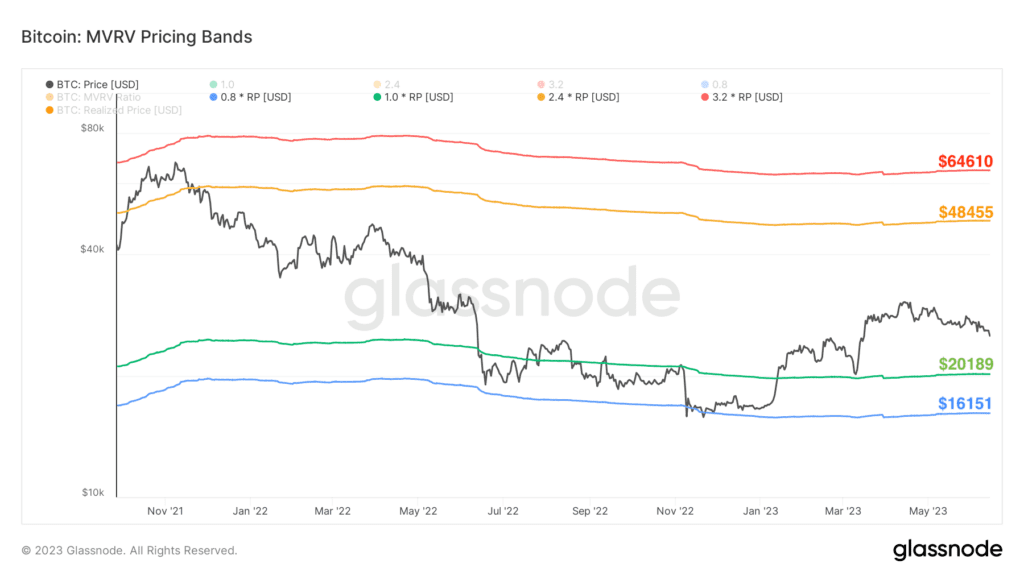
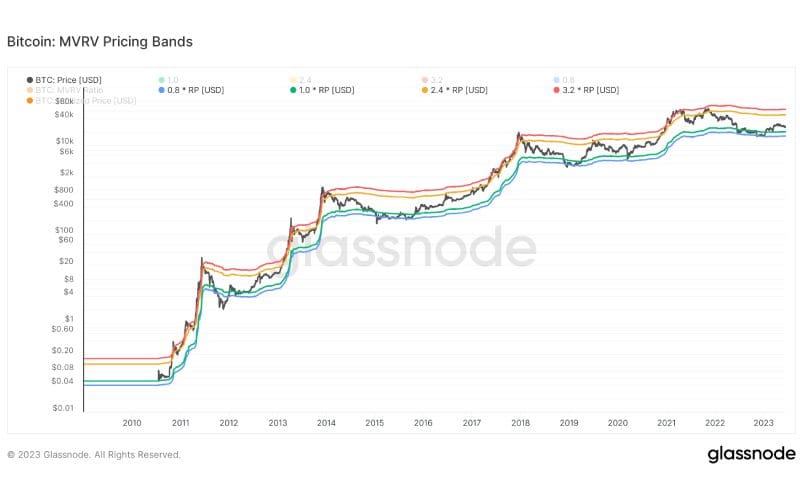
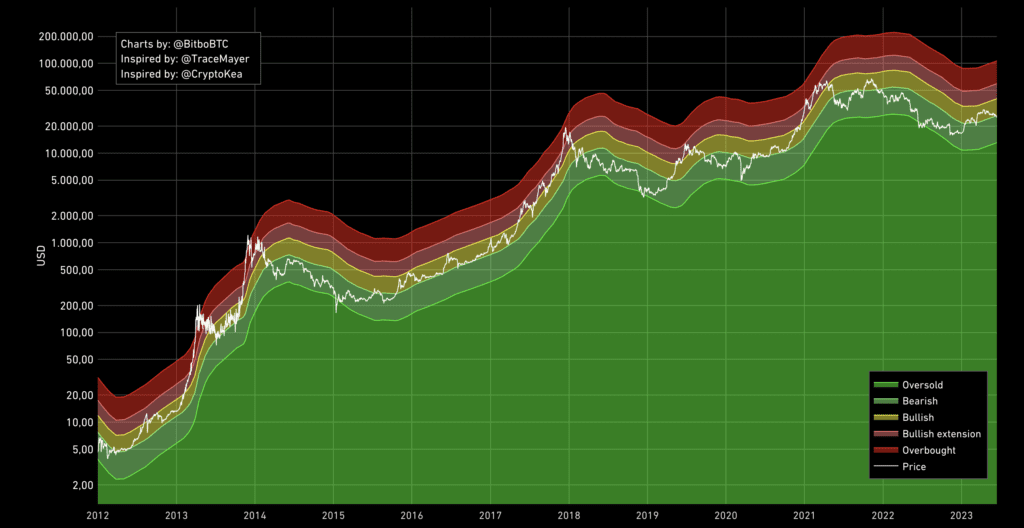
Bitcoin, geçmişte yeşil ve mavi bantlar arasındaki hareketinden sonra yükseliş yaşamış ve ardından turuncu banda kadar yükseliş göstermiş. Kesinlik yok ancak şu anki fiyat hareketi de aynı şekilde olursa bugünkü turuncu direnç $48455. Yeşil destek bandı fiyatı $20189.
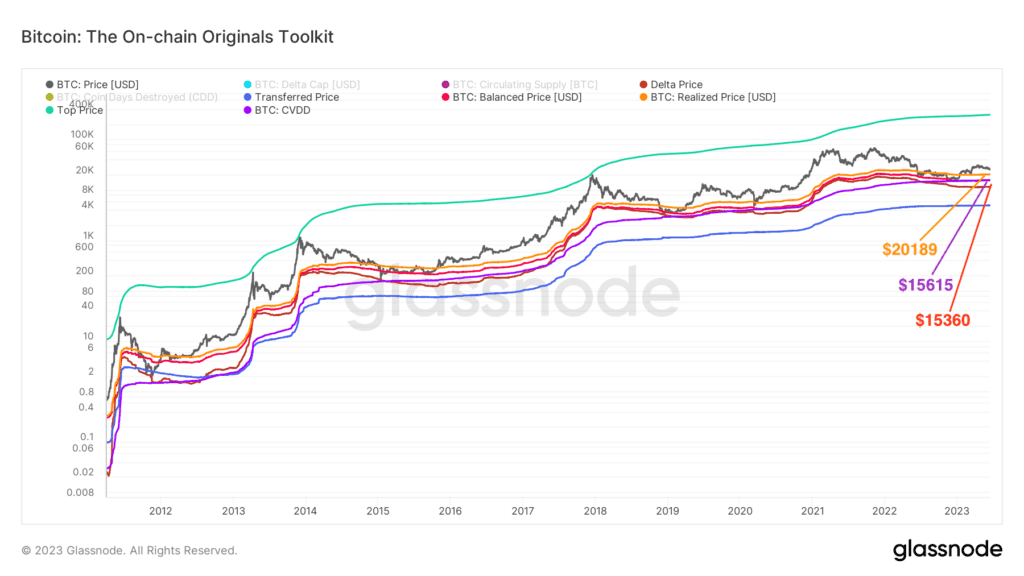
Bu grafikteki veriye göre Bitcoin, bordo ve mor bantlarda tutunduktan sonra turuncuya ilerlemiş. Turuncu bant üstünde tutundukça boğa sezonu yaşanmış ve turkuaz banda ilerleme görülmüş. Bugünkü turuncu bant desteği $20189. Bu değer aynı zamanda Bitcoin’in “gerçek değerini“ temsil ediyor.
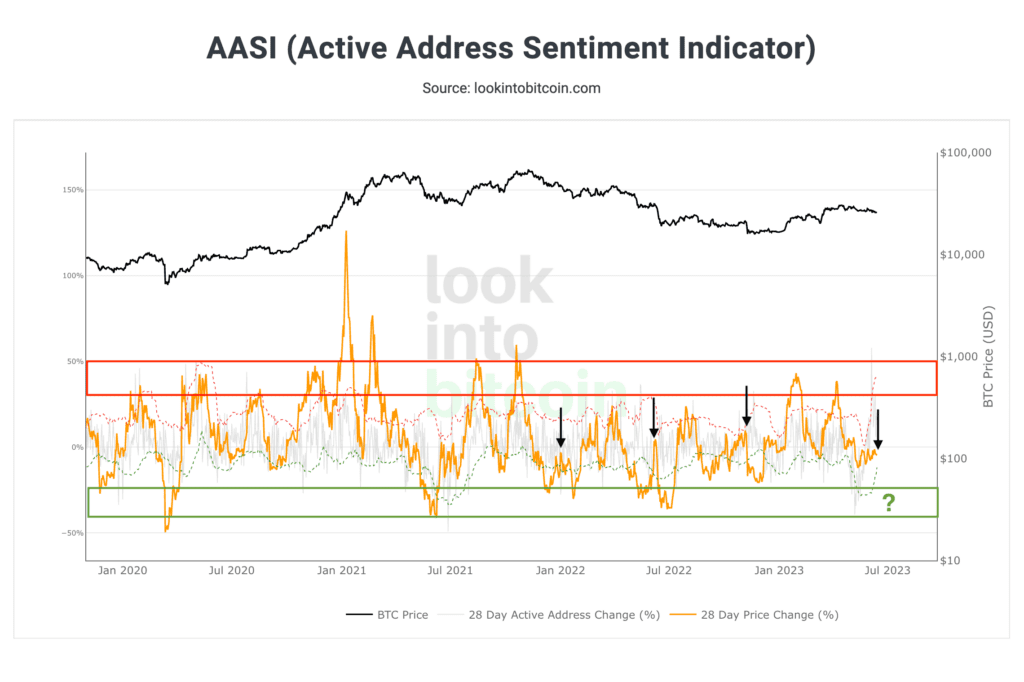
Active Address Sentiment Indicator grafiğine göre, Bitcoin orta bant direncini aşmakta zorlanıyor, fiyat hareketindeki zayıf ilerleyiş de alt ana desteği isteyebileceğini gösteriyor. Fiyat düşüşlerinde ana desteği takip ediyor olacağız.
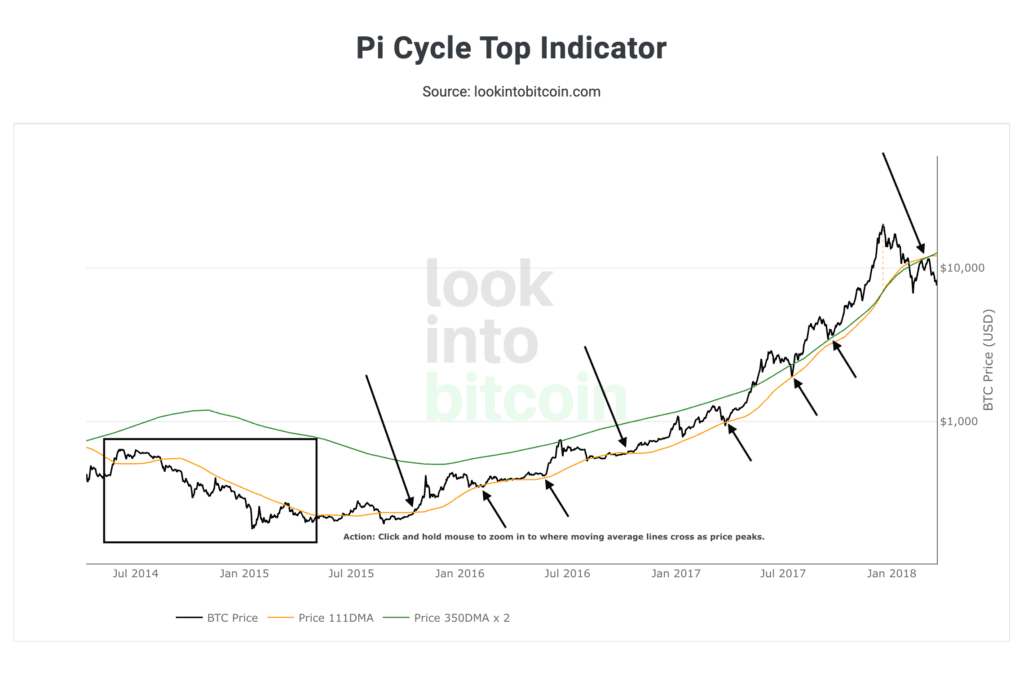
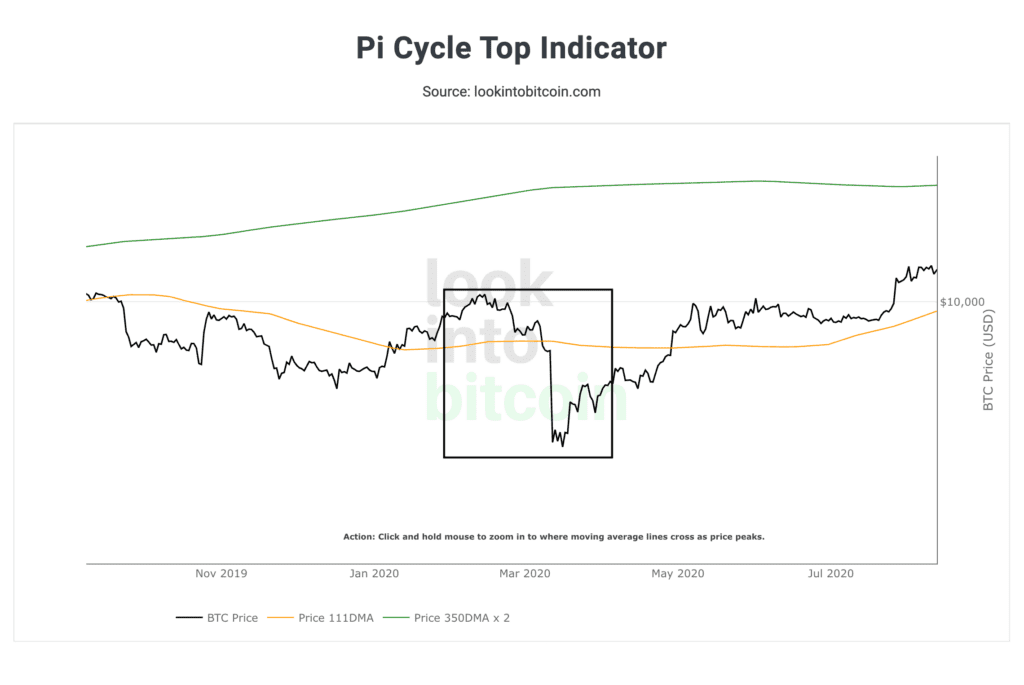
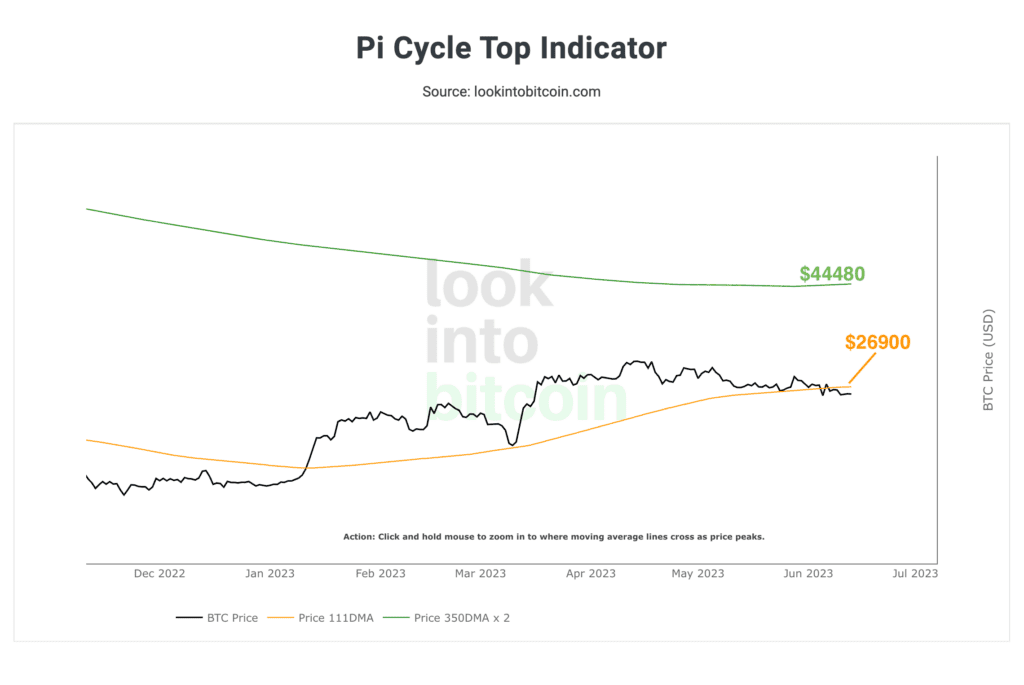
Geçmişte Bitcoin, 111D MA desteğini kırdığında çok keskin düşüşler yaşadı. Bir önceki analizde de söylediğimiz gibi bu desteğin kırılması ve geri kazanılamaması sert düşüşlerin habercisi oldu. Bitcoin’in güzel yükselişler yaşaması için $26890 dolar direncini kalıcı olarak geri kazanması gerekiyor.
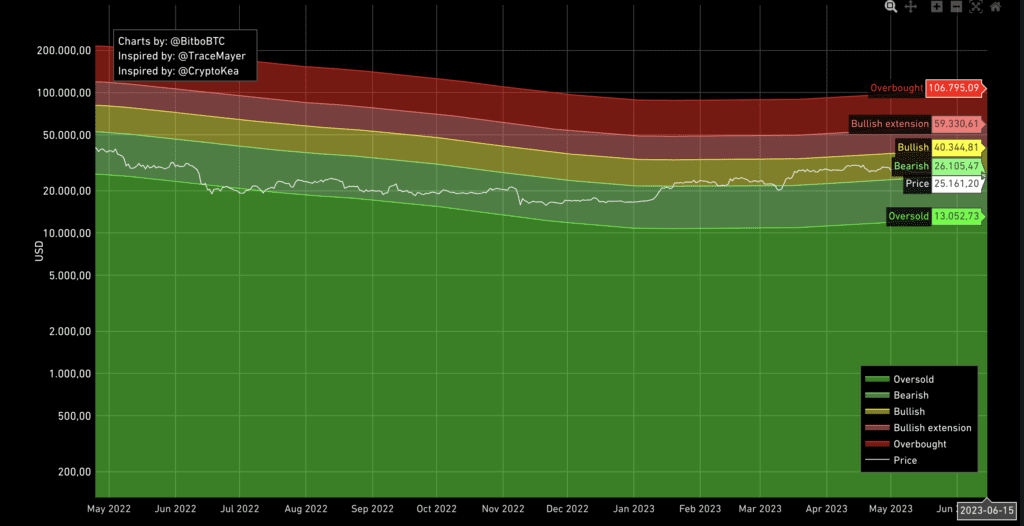
Bitcoin’in yükseliş yapısını korumak için tutması gereken seviye $26105 dolardı. Bitcoin bu güçlü desteği kaybedince düşüş derinleşti. Bitcoin’in güzel yükselişler yaşaması için $26105 dolar direncini kalıcı olarak geri kazanması gerekiyor. Daha da keskin artışlar yapabilmek için $40344 seviyesini aşması bekleniyor. Tekrar derin bir ayı sezonu olursa izlenecek seviye şimdi $13052‘dır.
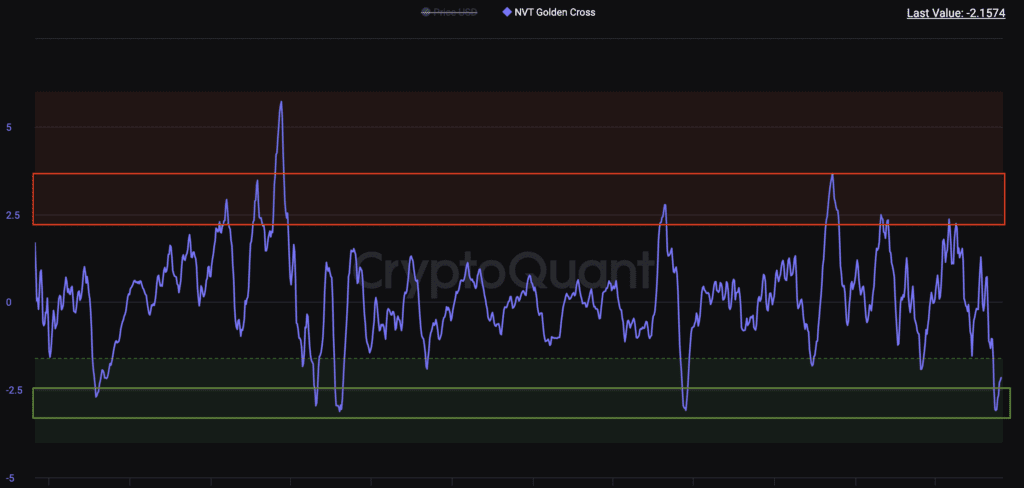
NVT Golden Cross grafiği, fiyat düşüşleriyle birlikte ana desteğe ilerlemiş görünüyor. Bu bölgedeki hareketini ve fiyat hareketini takip ediyor olacağız.
Onchain verileri ve açıklamalarına yazımızdan göz atabilirsiniz.
Onchain analiz, blockchain piyasalarından elde edilen verilerden oluşur ve sadece borsalara giriş ve çıkışları yansıtır. Bu veriler olumlu veya olumsuz şekilde yorumlanabilir, ancak boğa veya ayı piyasasıyla ilgili kesin bir öngörü içermez. Yukarıda paylaşılan tüm analizler eğitim amaçlıdır, bu gönderi herhangi bir finansal tavsiye içermez.