


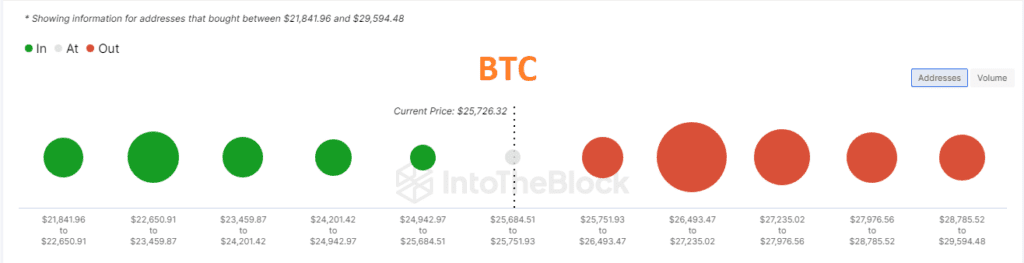
Onchain üzerinde $26493-$27975 maliyetli kullanıcılar yüksek zararda görünüyor. $24200-$25685 maliyetli kullanıcıların karı ise azalmış durumda. Kırmızı küreler ne kadar büyük , yeşil küreler ne kadar küçük ise yükseliş ihtimali o kadar yükselir. Yeşil küreler ne kadar büyük, kırmızılar küreler ne kadar küçük ise düşüş ihtimali o kadar yükselir. Kürelerin bulunduğu seviye aralıkları güçlü destek ya da güçlü direnç olarak çalışabilir. Bitcoin şu anda, kısa vadede tepki yükselişine yakın gibi görünüyor.
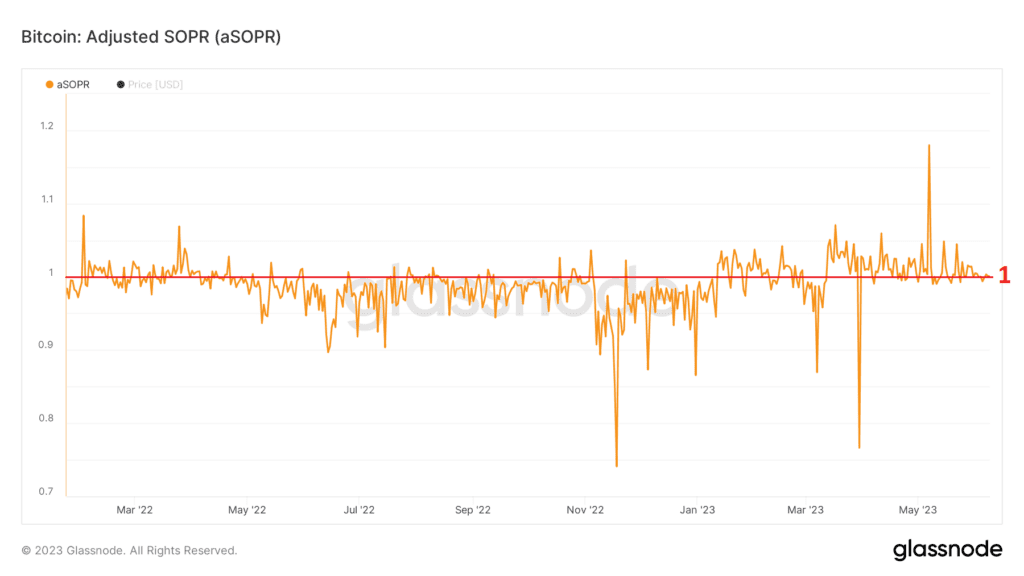
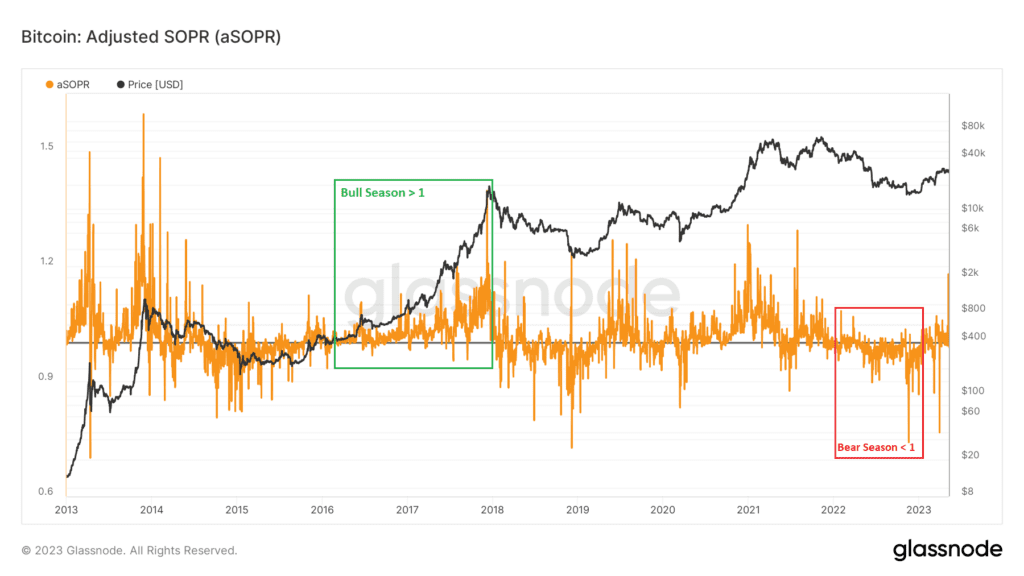
ASOPR verisi boğa sezonlarında çoğunlukla 1 seviyesi ve üzerinde, ayı sezonunda 1 seviyesi ve altında performans göstermiş. Bitcoin boğa sezonunda ise bu verinin 1 seviyesinden yukarıda tutunması gerekir.
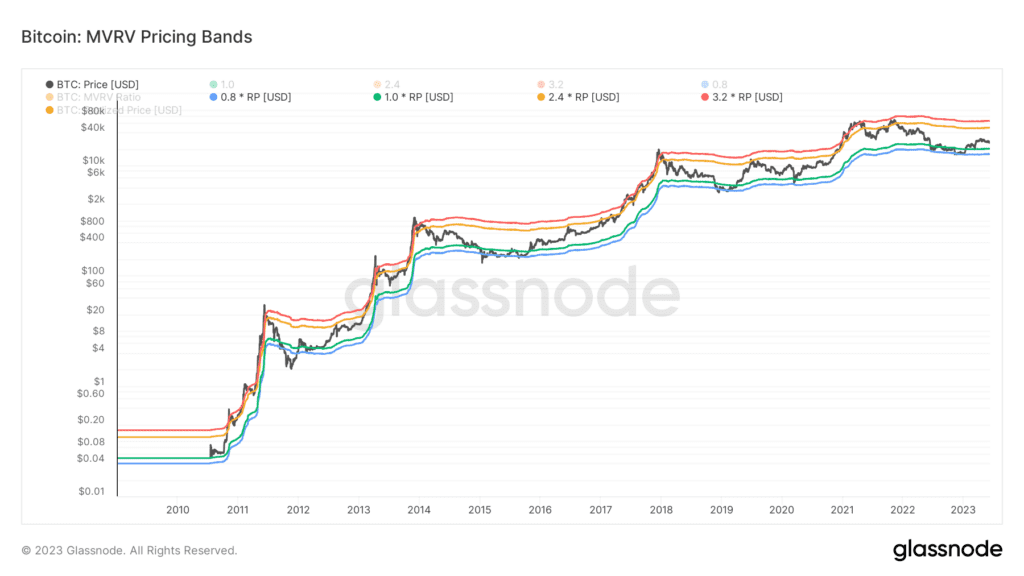
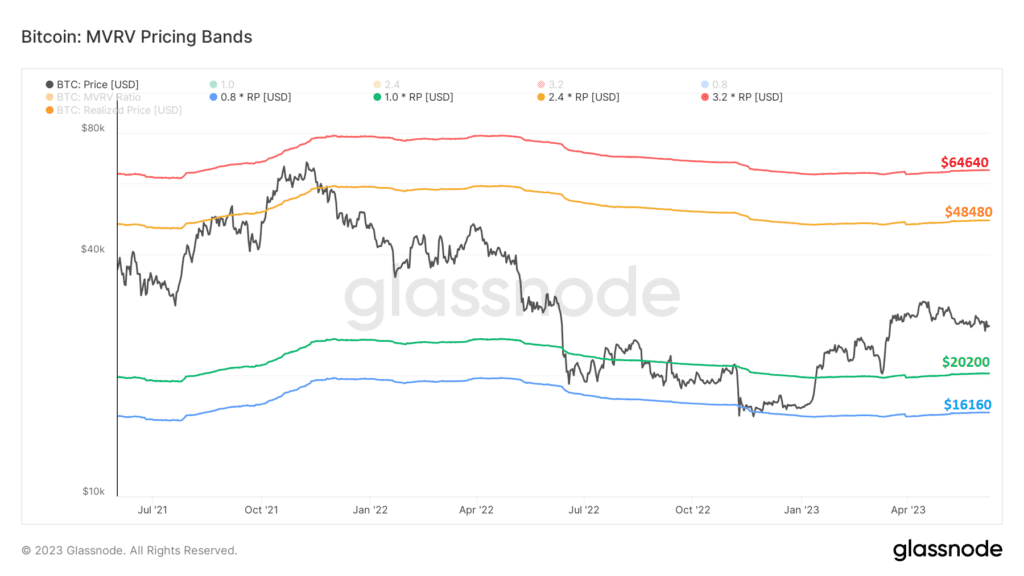
Bitcoin, geçmişte yeşil ve mavi bantlar arasındaki hareketinden sonra yükseliş yaşamış ve ardından turuncu banda kadar yükseliş göstermiş. Kesinlik yok ancak şu anki fiyat hareketi de aynı şekilde olursa bugünkü turuncu direnç $48480. Yeşil destek bandı fiyatı $20200.
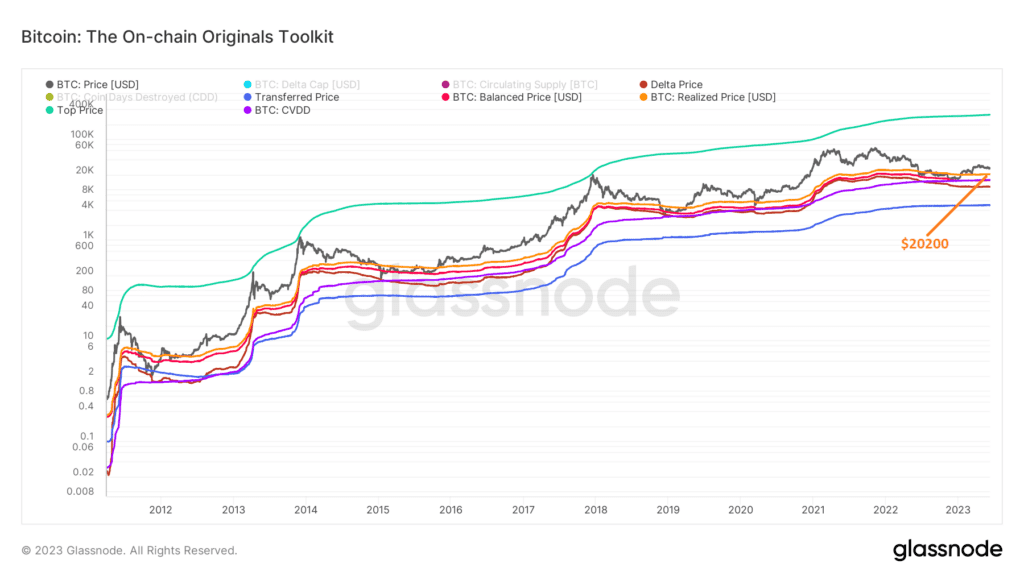
Bu grafikteki veriye göre Bitcoin, bordo ve mor bantlarda tutunduktan sonra turuncuya ilerlemiş. Turuncu bant üstünde tutundukça boğa sezonu yaşanmış ve turkuaz banda ilerleme görülmüş. Bugünkü turuncu bant desteği $202020. Bu değer aynı zamanda Bitcoin’in “gerçek değerini“ temsil ediyor.
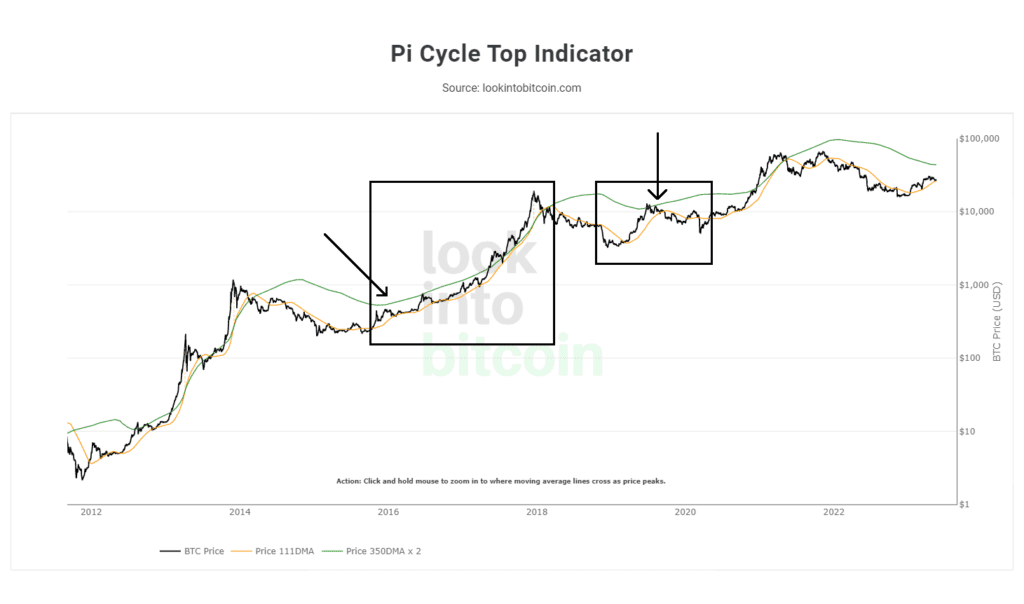
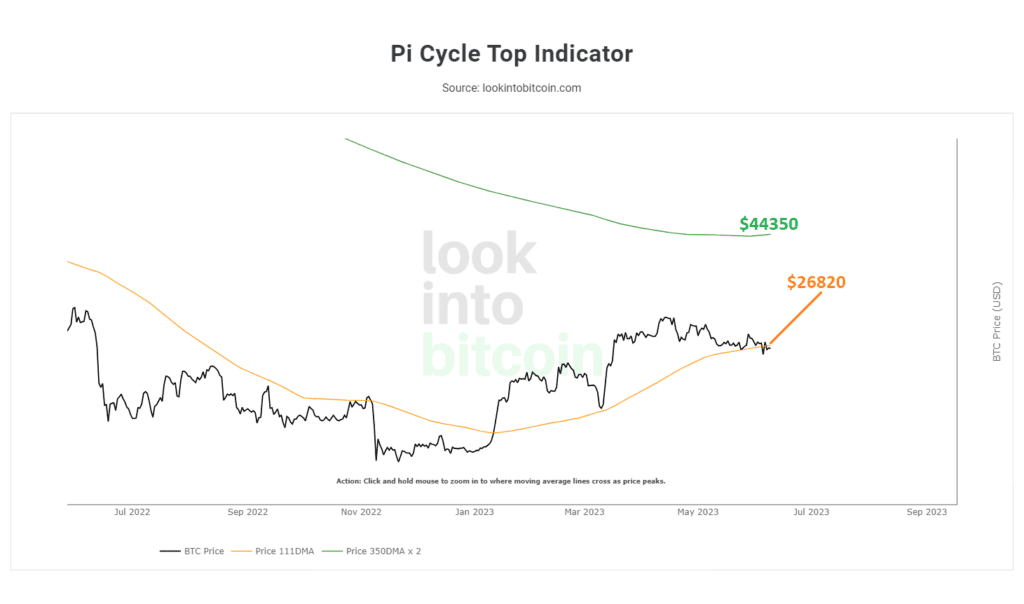
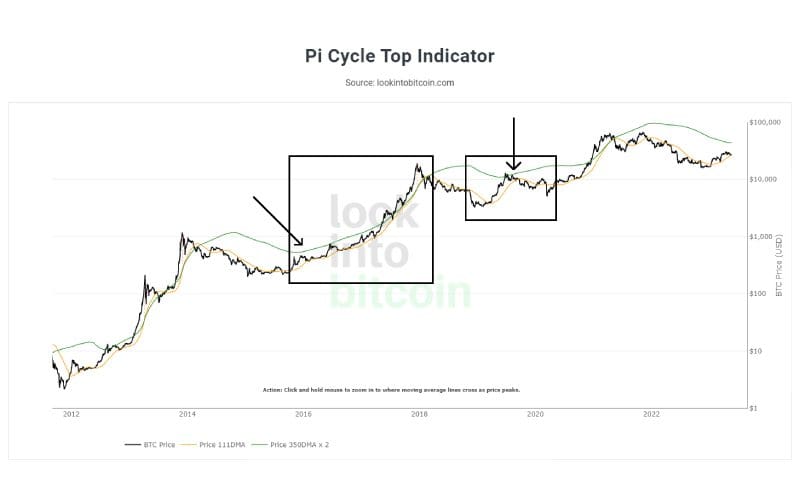
Pi Cycle Top Indicator verilerine göre Bitcoin, çok güçlü bir destek olan 26400$-26600$ bandını tutmaya çalışıyordu. Mevcut turuncu bant fiyat değeri, şu anda güçlü bir direnç olan 26820$. Turuncu bandın altında günlük veya haftalık kapanış olursa düşüşün derinleşebileceğinden bahsetmiştik ve maalesef bu gerçekleşti. Bitcoin bir an önce tekrar 26820 seviyesinin üzerine çıkmalı. Turuncu bandın altında kaldığı her gün düşüşler derinleşme tehlikesi yaşıyor.
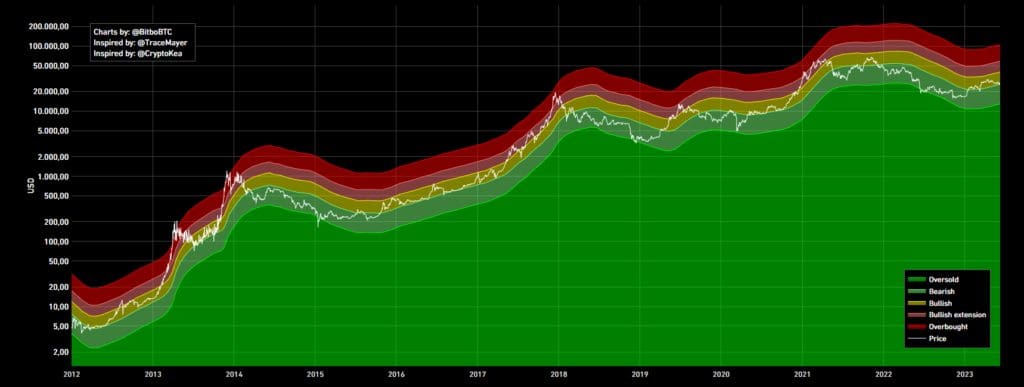
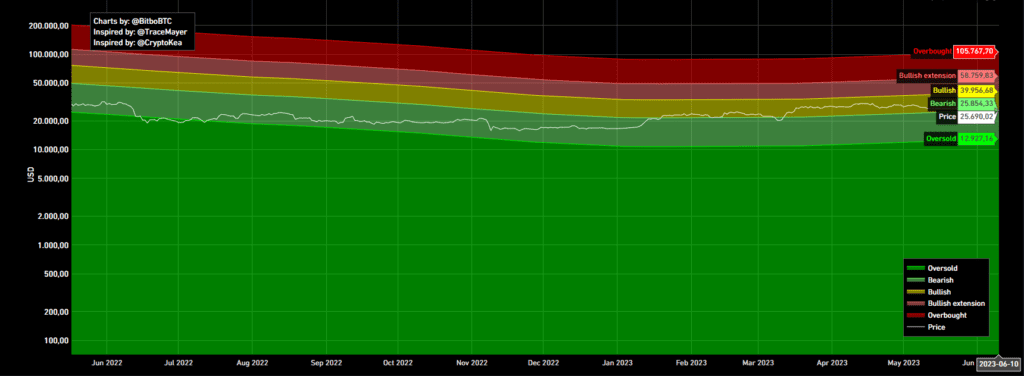
Bitcoinin bullish yapısını koruması için $25850 seviyesini koruması gerekiyordu. Bitcoin bu desteği kaybedince, düşüş daha da derinleşti. Daha da sert yükselişler yapabilmesi için $39960seviyesini aşması beklenir. Tekrar derin bir ayı sezonu yaşanması durumunda izleyeceğimiz destek seviyesi $12920.
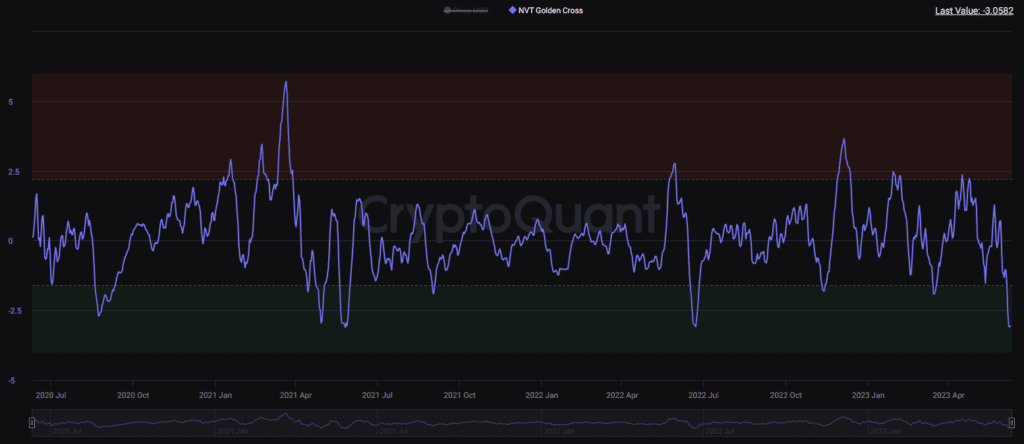
NVT Golden Cross göstergesi, düşüş derinleşirken ana destek bölgesine ilerledi. Bu bölgede ne kadar kalacağını kesin olarak söyleyemeyiz ancak fiyata yakın güçlü desteklerin takip edilmesi gerekiyor.
Onchain verileri ve açıklamalarına yazımızdan göz atabilirsiniz.
Onchain analiz, blockchain piyasalarından elde edilen verilerden oluşur ve sadece borsalara giriş ve çıkışları yansıtır. Bu veriler olumlu veya olumsuz şekilde yorumlanabilir, ancak boğa veya ayı piyasasıyla ilgili kesin bir öngörü içermez. Yukarıda paylaşılan tüm analizler eğitim amaçlıdır, bu gönderi herhangi bir finansal tavsiye içermez.