


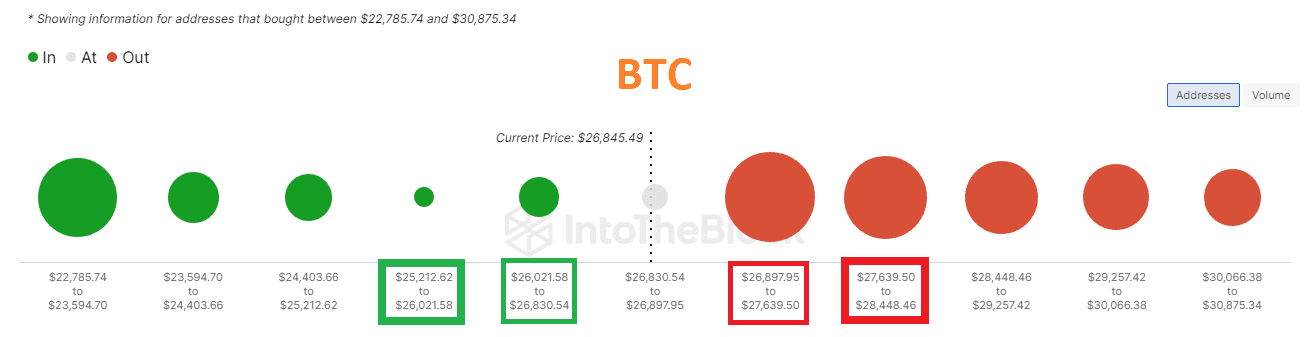
Onchain üzerinde $26897-$28448 maliyetli kullanıcılar çok yüksek zararda görünüyor. Kırmızı küreler ne kadar büyük , yeşil küreler ne kadar küçük ise yükseliş ihtimali o kadar yükselir. Yeşil küreler ne kadar büyük, kırmızılar küreler ne kadar küçük ise düşüş ihtimali o kadar yükselir. Kürelerin bulunduğu seviye aralıkları güçlü destek ya da güçlü direnç olarak çalışabilir. Mevcut durumda, Bitcoin yukarı yönlü tepki yükselişine çok yakın duruyor.
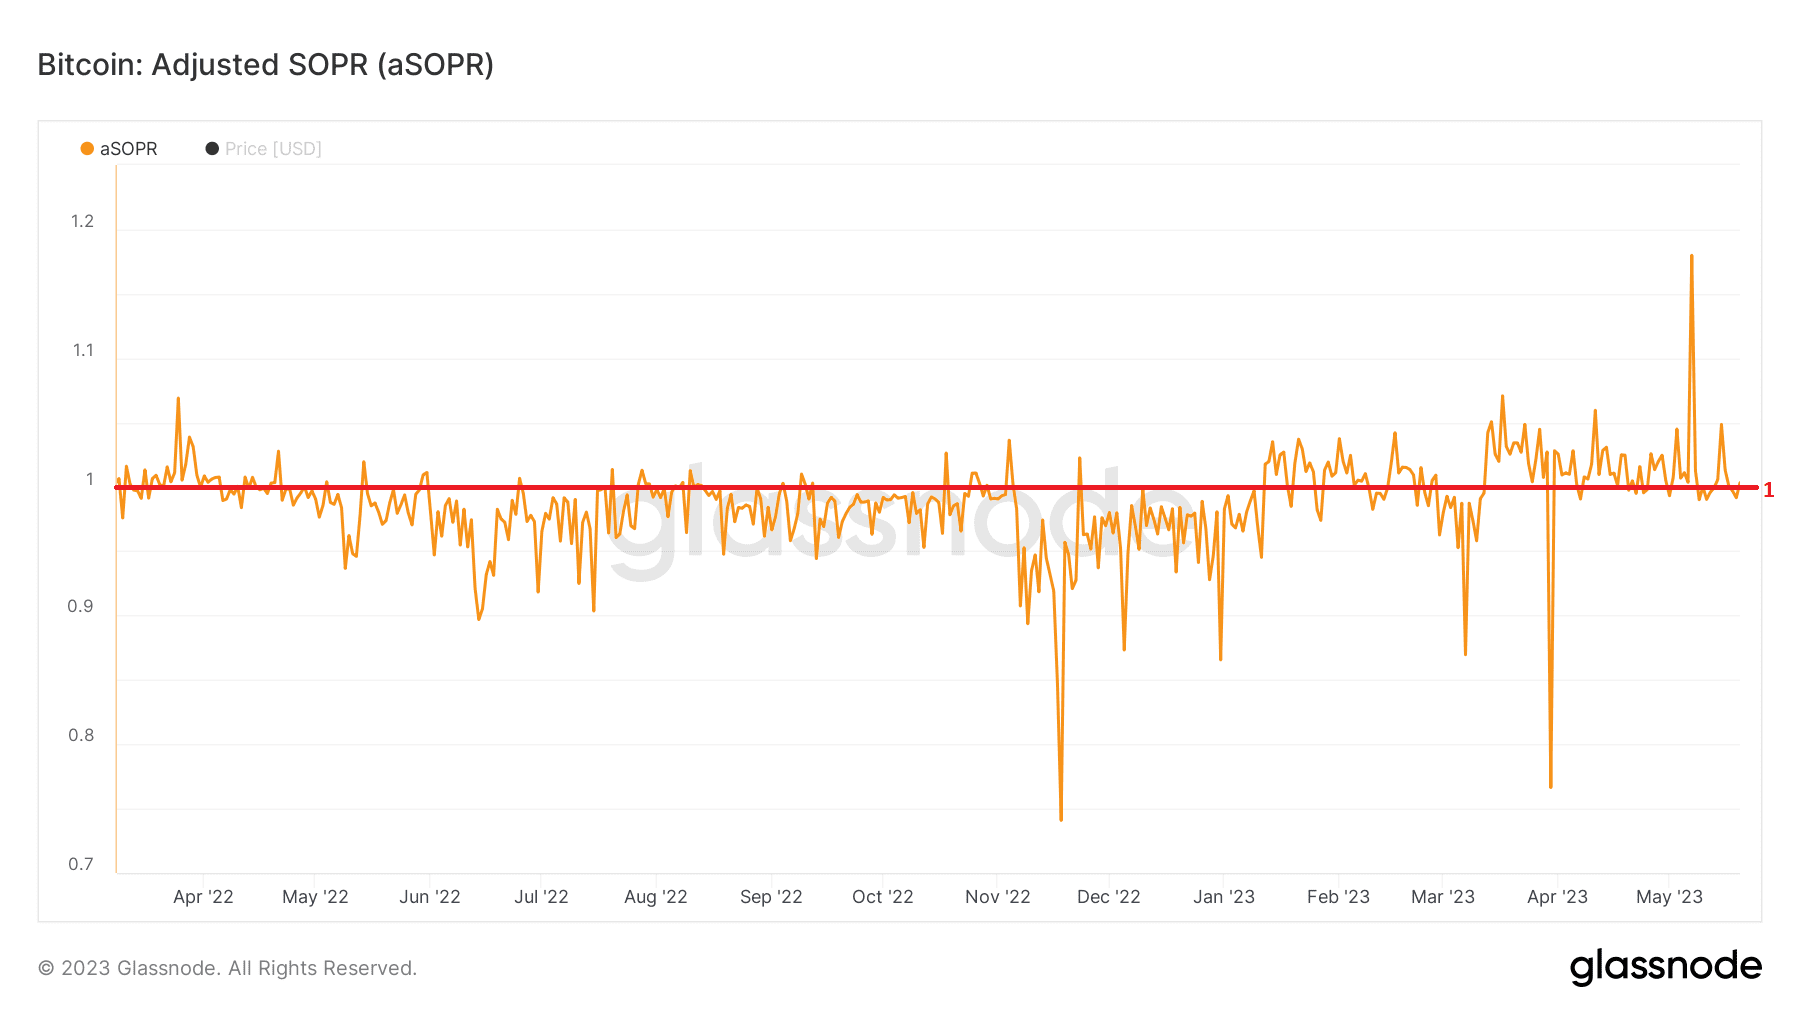
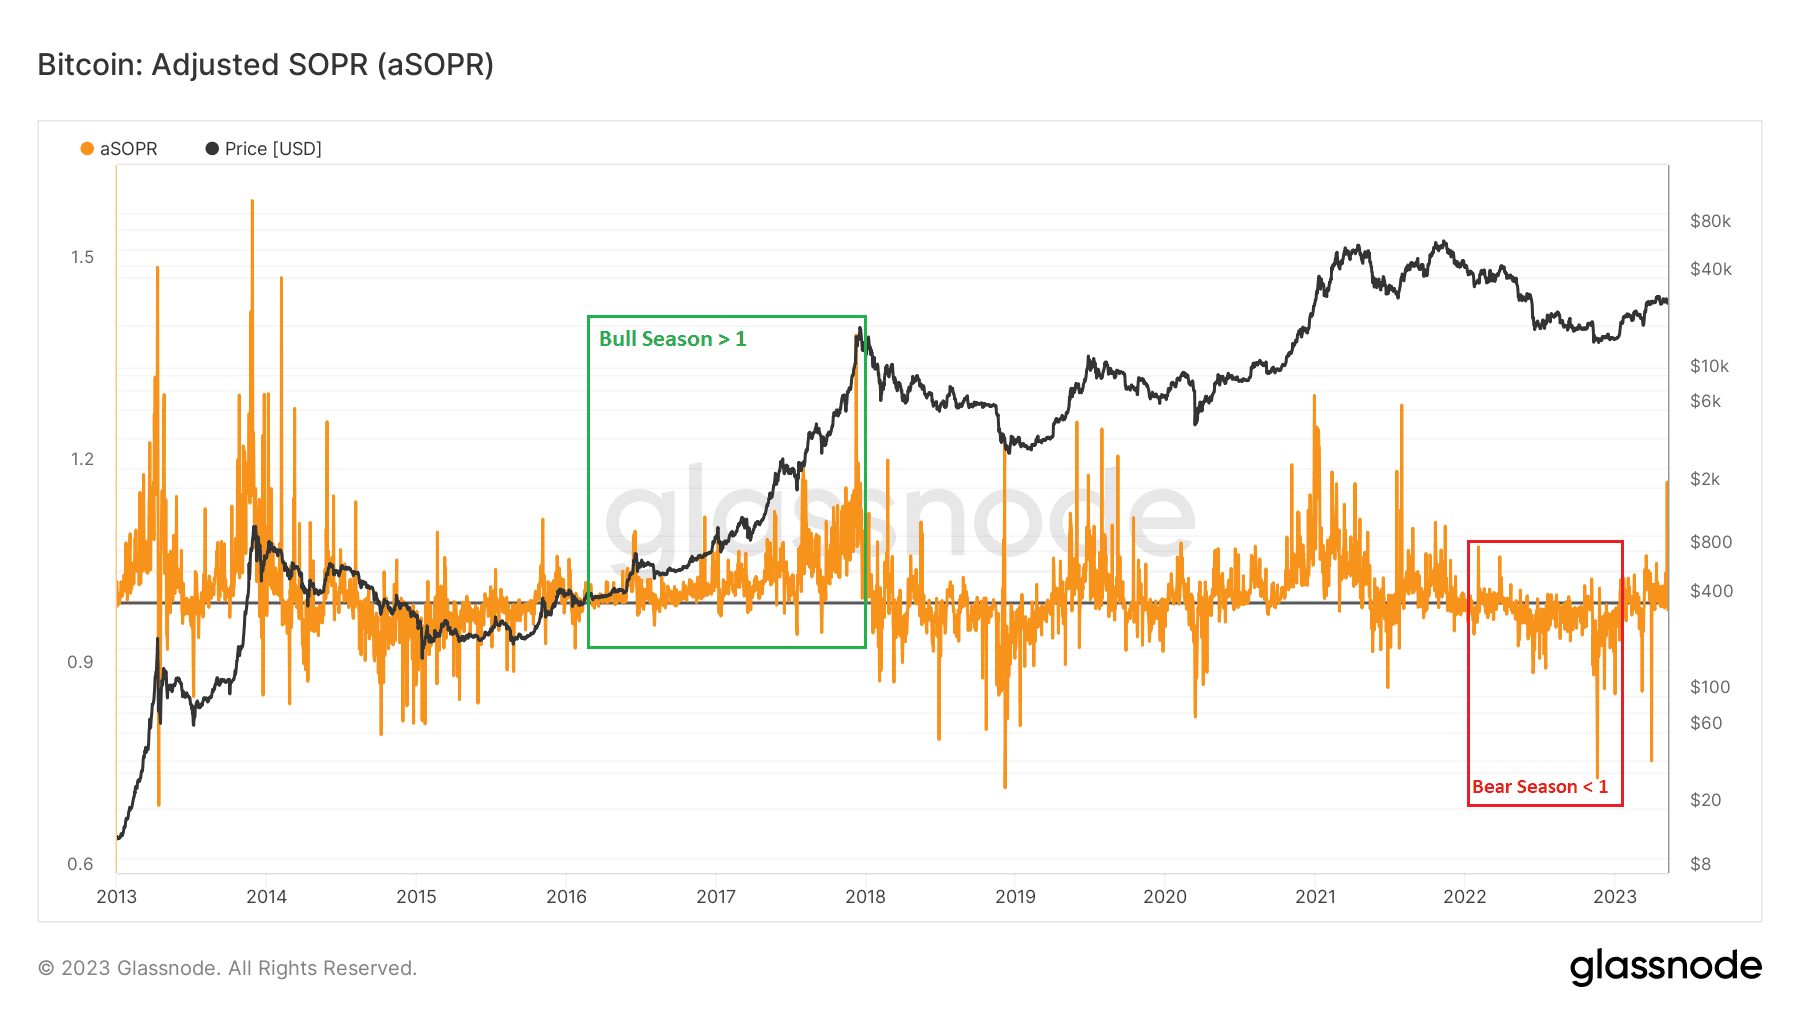
ASOPR verisi boğa sezonlarında çoğunlukla 1 seviyesi ve üzerinde, ayı sezonunda 1 seviyesi ve altında performans göstermiş. Bitcoin boğa sezonunda ise bu verinin 1 seviyesinden yukarıda tutunması gerekir.
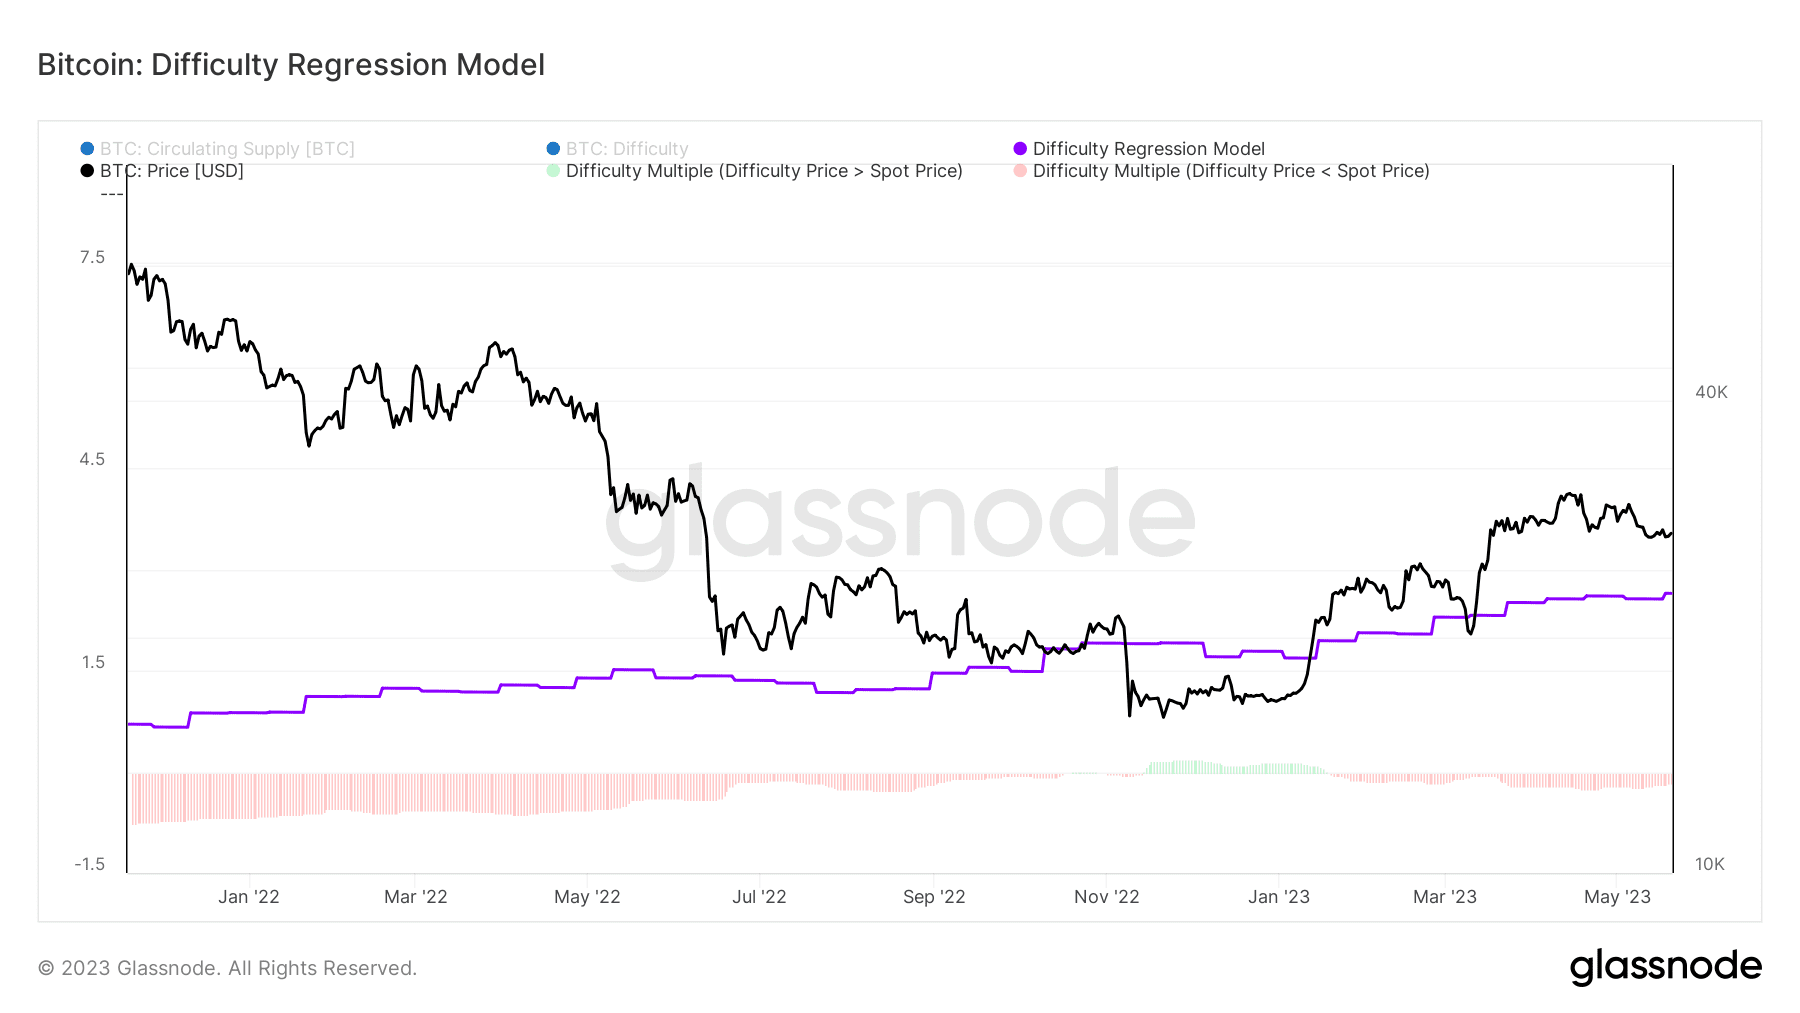
Madencilerin Bitcoin kazım maliyeti $22735. Şu anki duruma bakılırsa madenciler oldukça kârlı Bitcoin kazımı yapıyorlar.
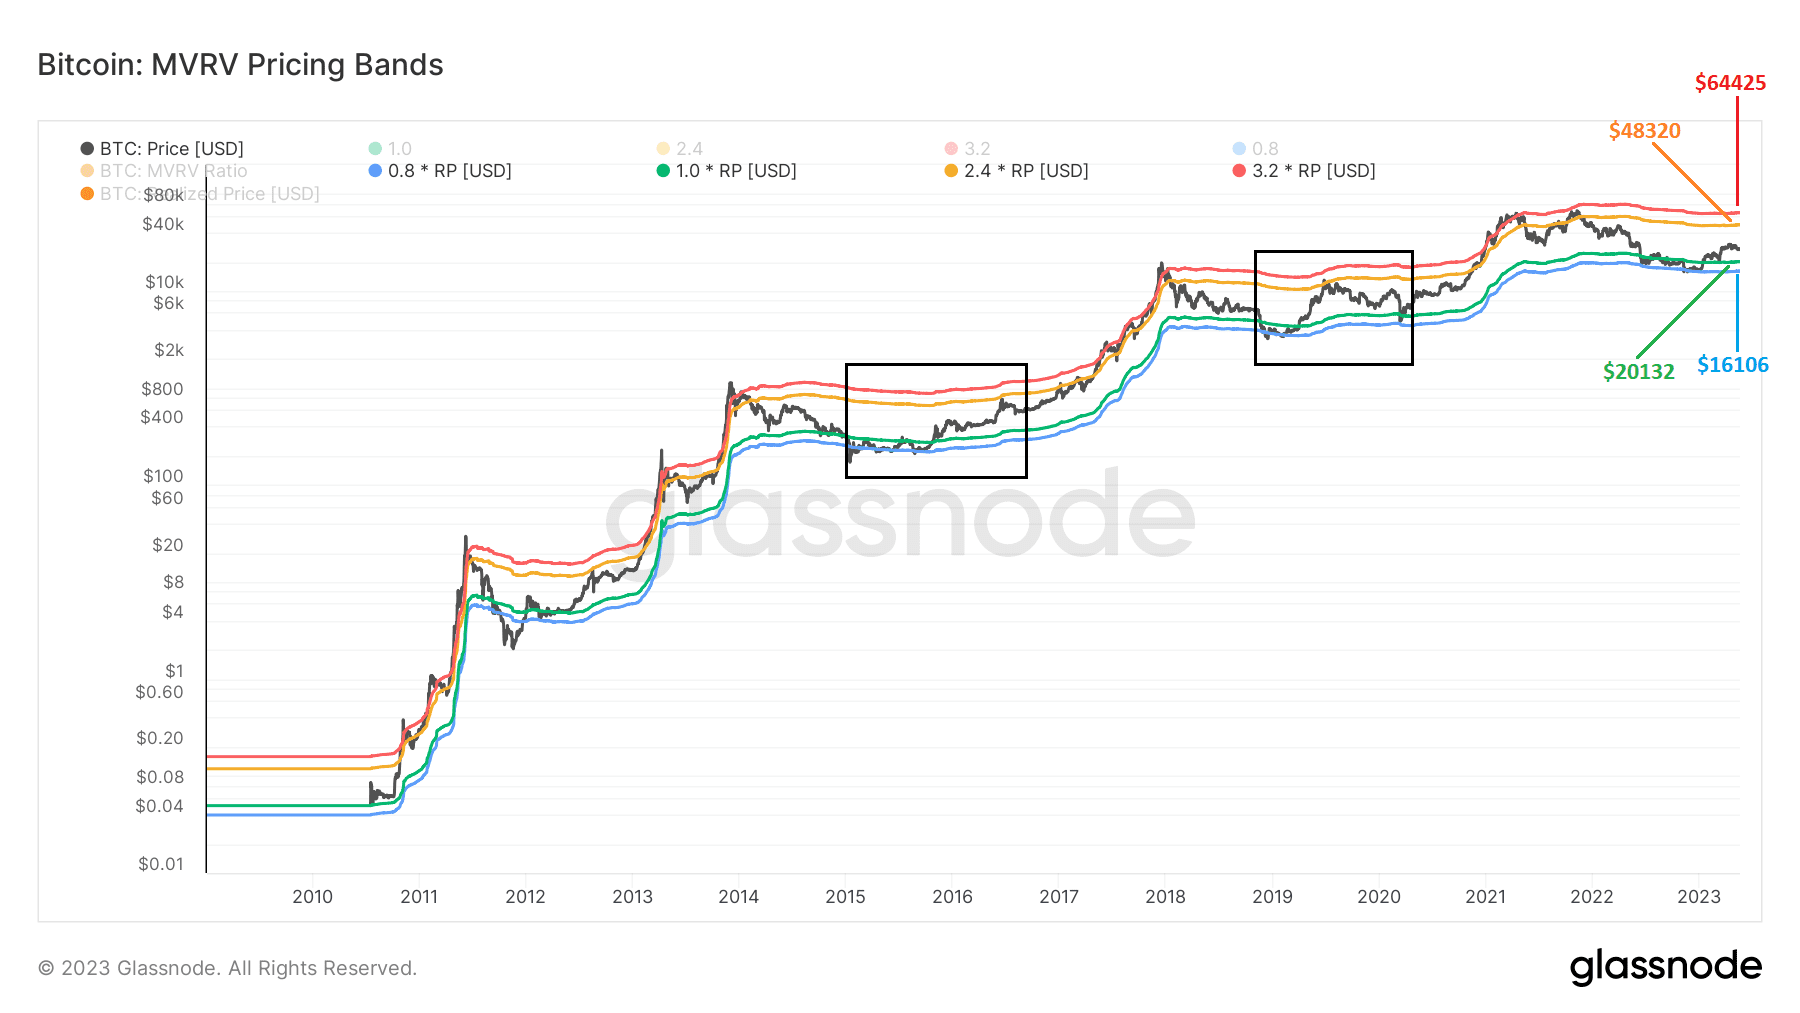
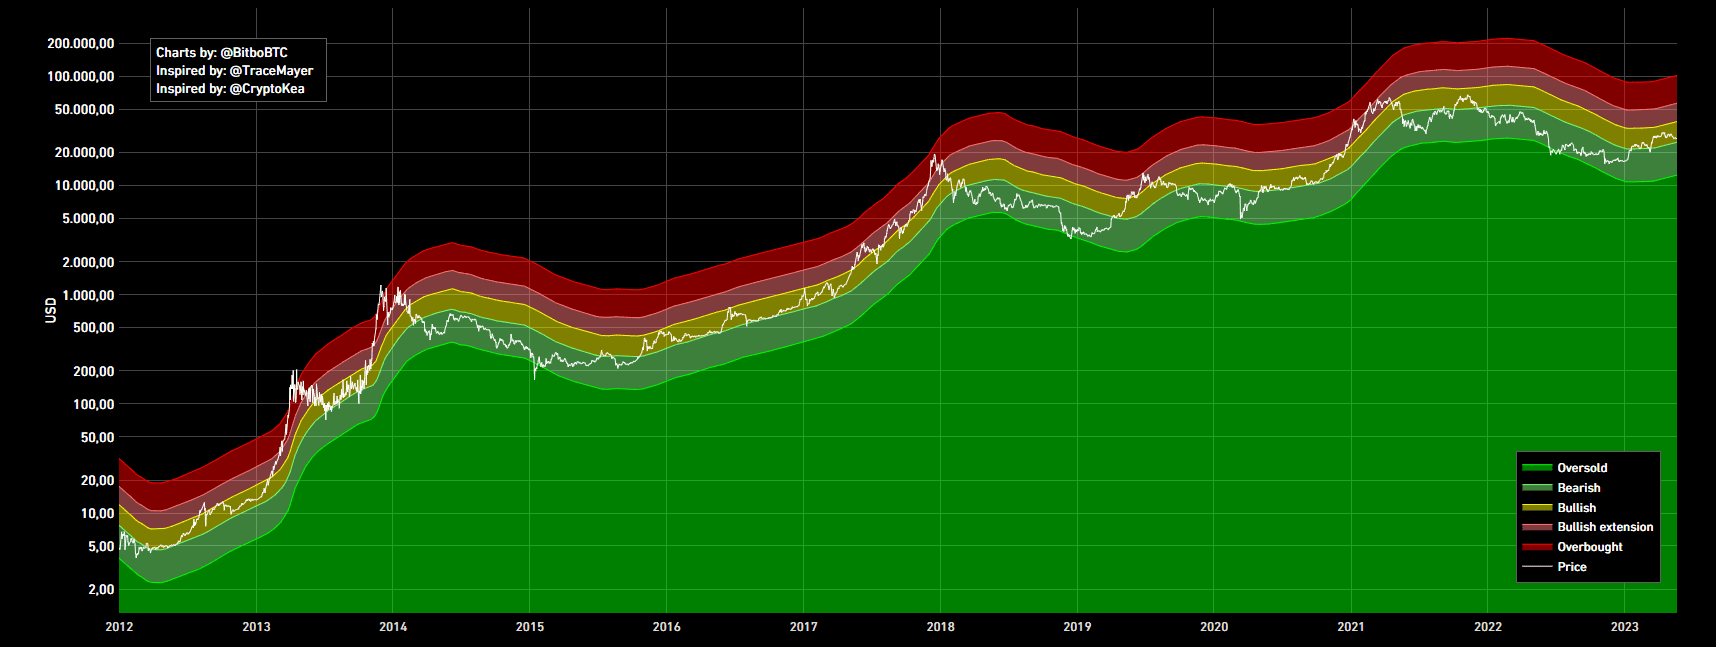
Bitcoin, geçmişte yeşil ve mavi bantlar arasındaki hareketinden sonra yükseliş yaşamış ve ardından turuncu banda kadar yükseliş göstermiş. Kesinlik yok ancak şu anki fiyat hareketi de aynı şekilde olursa bugünkü turuncu direnç $48320. Yeşil destek bandı fiyatı $20132.
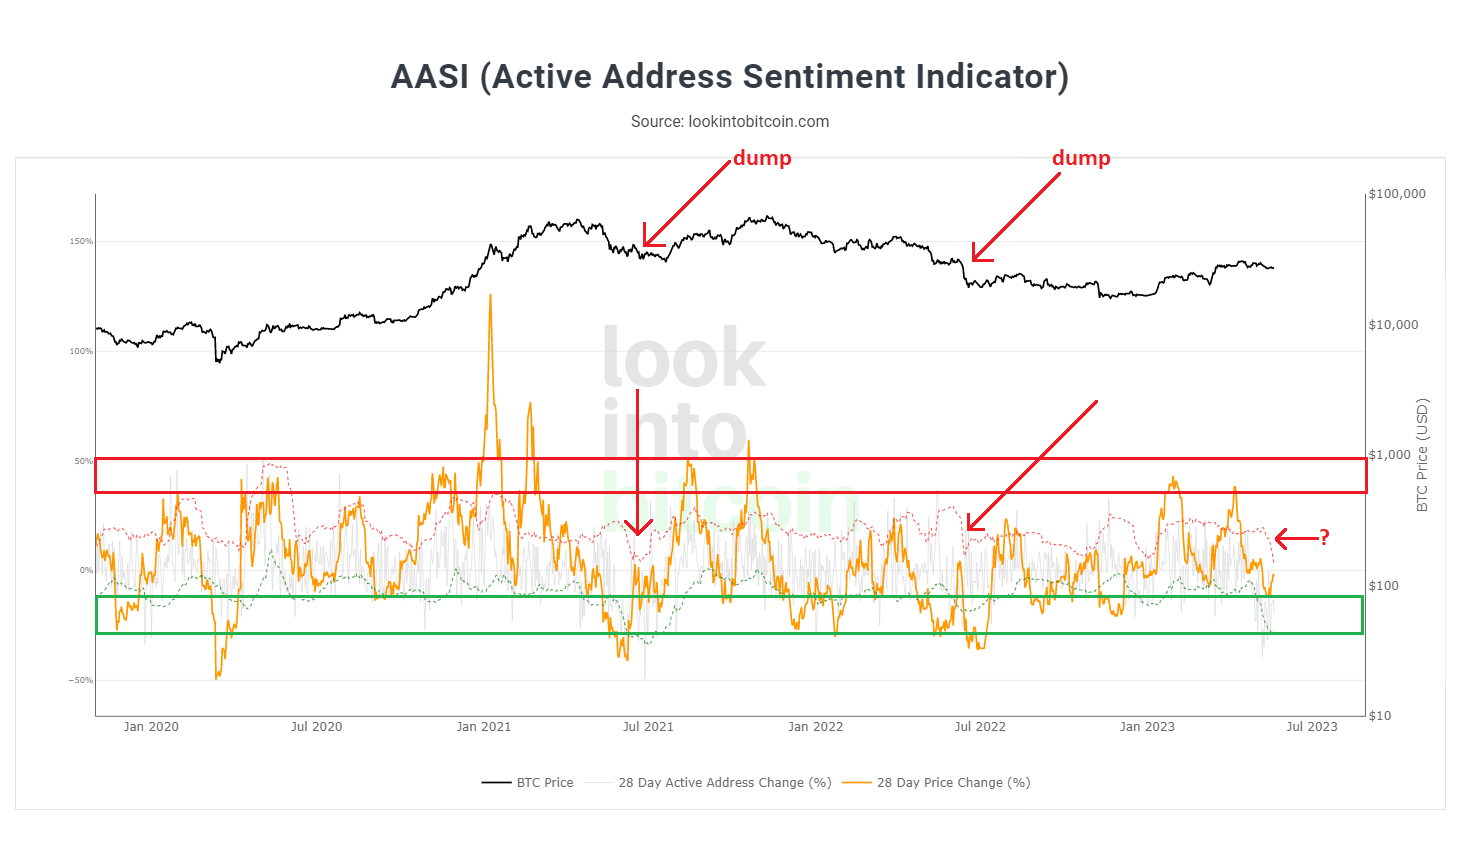
The Active Address Sentiment Indicator verisi, ana destek bölgesinden tepki almış görünüyor. Kırmızı bandın oldukça sert şekilde düştüğünü görüyoruz. Geçmişte aynı durum olduğunda Bitcoin sert düşüşler yaşamış. Hiçbir veri tek başına yeterli değildir ancak diğer verilerle paralel bilgiyi veren dikkate alınması gereken bir veri.
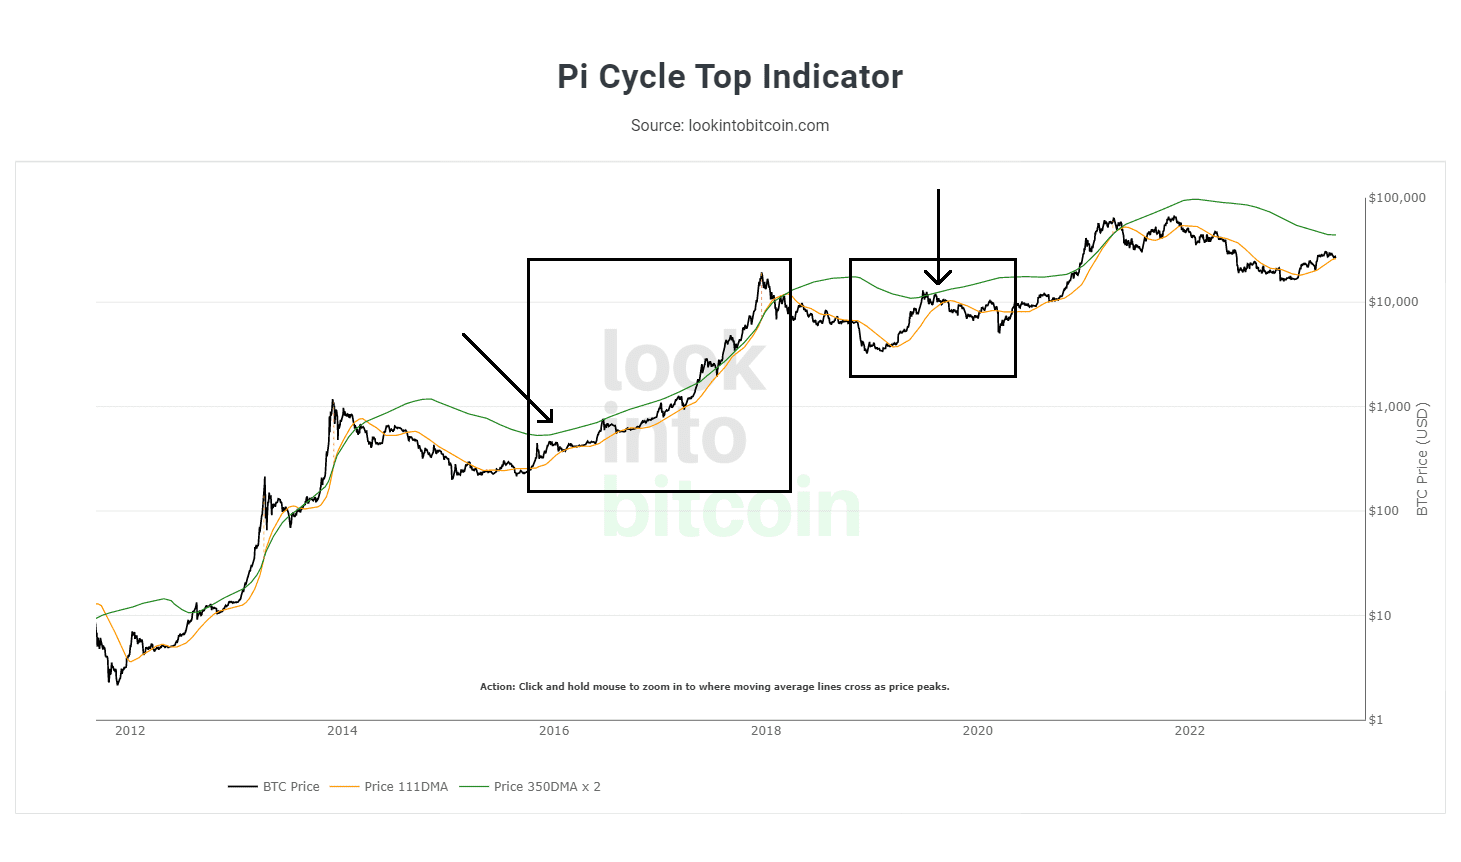
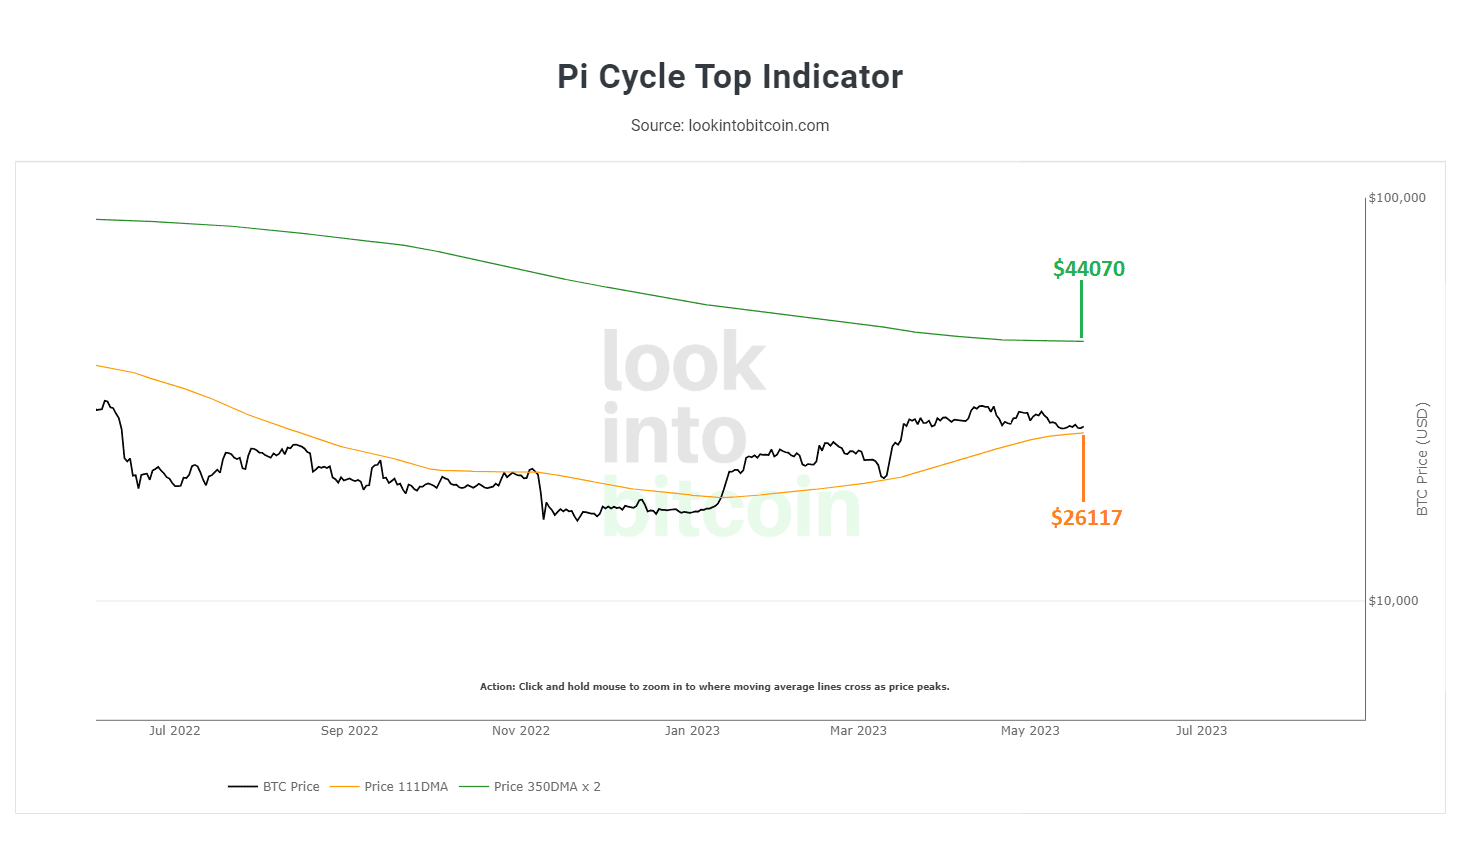
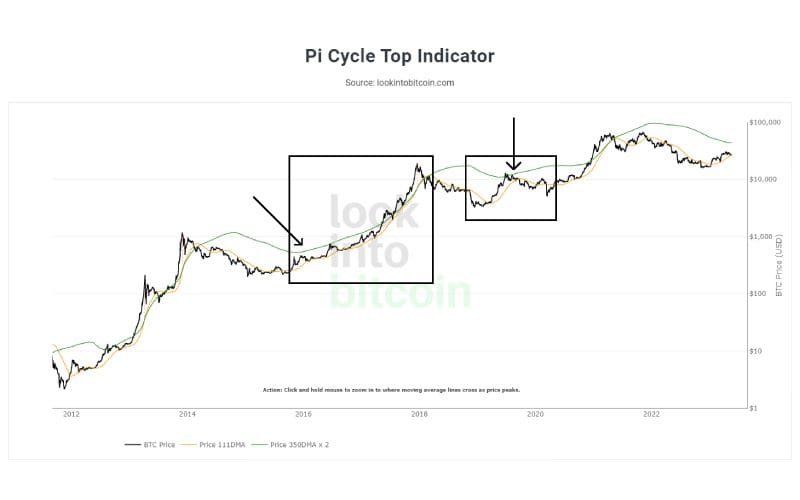
Pi Cycle Top Indicator verisine göre, $25700-$25800 (turuncu banttan) bölgesinden bitcoin güçlü bir tepki aldı. Turuncu bant fiyat değeri şu an $26117 Turuncu bant altı günlük ya da haftalık kapanışlarda düşüş derinleşebilir. Takip ediyor olacağız.
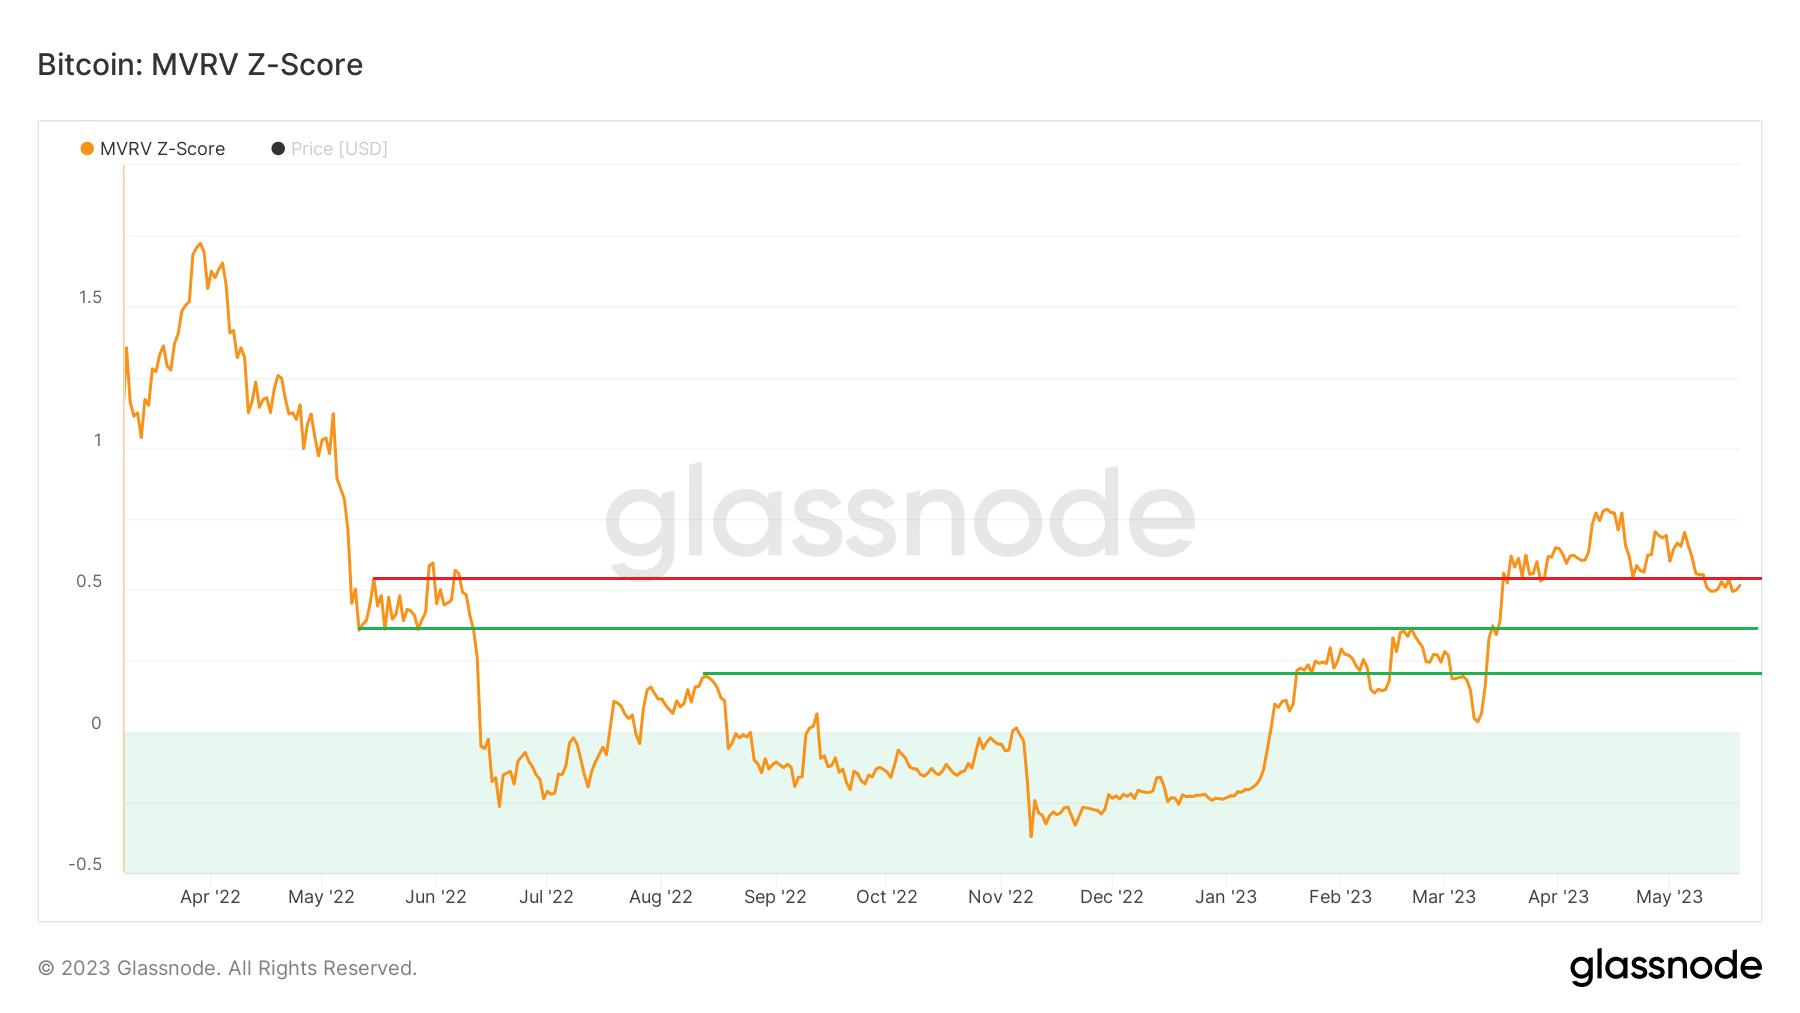
MVRV Z-Skoru, Bitcoin’in “gerçeğe uygun değerine” göre ne zaman fazla ya da az değerli olduğunu değerlendirmek için kullanılır. Piyasa değeri, gerçekleşen değerden önemli ölçüde yüksek olduğunda, tarihsel olarak bir piyasa zirvesini (kırmızı bölge) gösterirken, tersi piyasa diplerini (yeşil bölge) gösterir. Kısa vadeli destek kırılmış görünüyor, bu durum Bitcoinde daha düşük fiyat seviyelerini işaret edebilir. Dikkat etmek gerek.
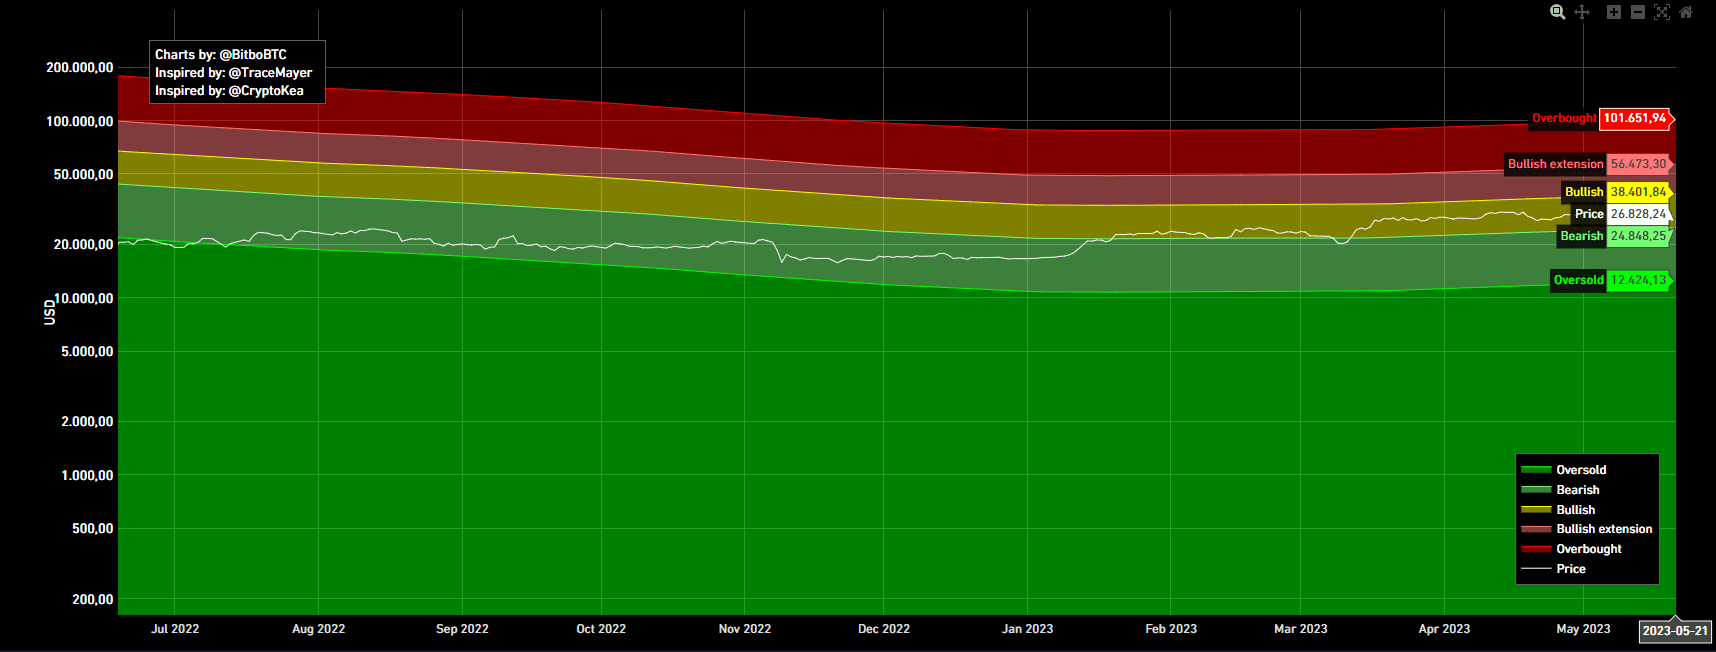
Bitcoinin bullish yapısını koruması için tutunması gereken seviye $24848. Daha da sert yükselişler yapabilmesi için $38400 seviyesini aşması beklenir. Tekrar derin bir ayı sezonu yaşanması durumunda izleyeceğimiz destek seviyesi $12424.
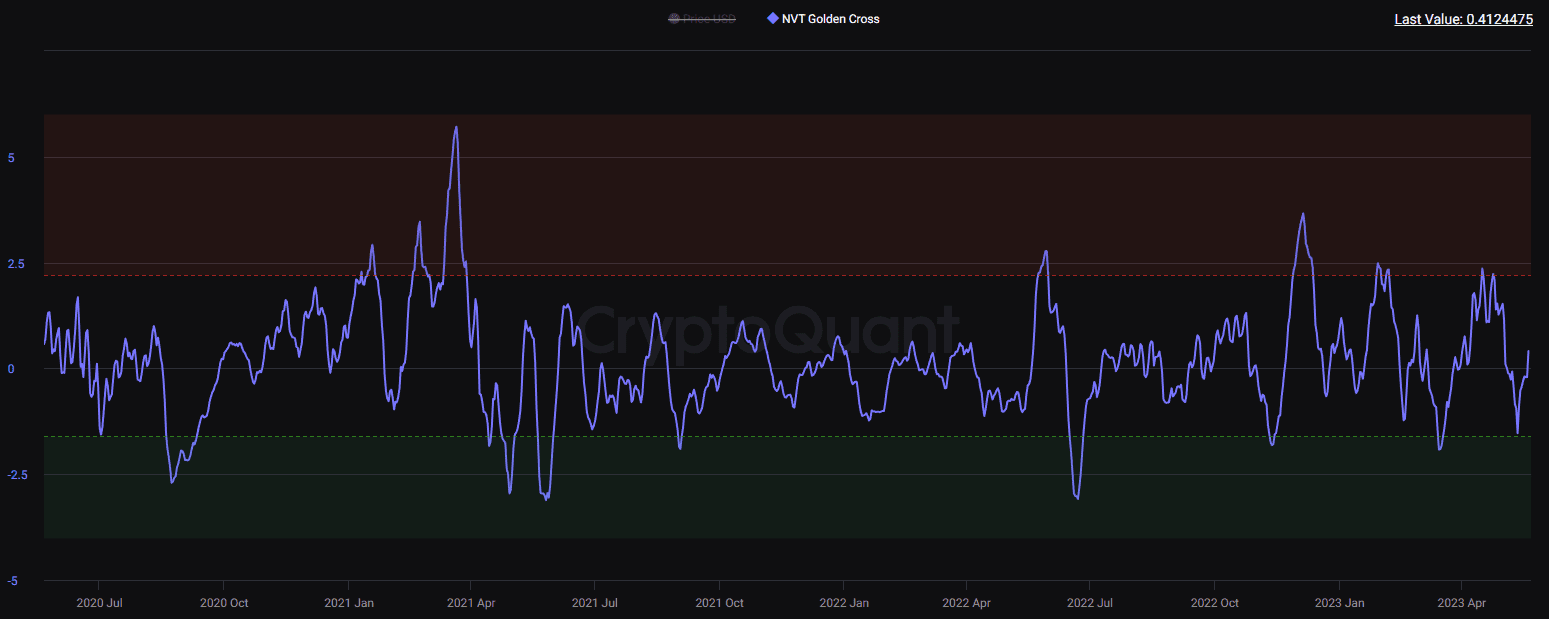
NVT Golden Cross verisi, Nisan sonundaki seviyelerinden düşüş yaşayarak ana destek bölgesine gelmiş ve oradan yukarı yönlü tepki almış görünüyor. Şu anda bant ortası dirence yaklaşmış durumda.
Onchain verileri ve açıklamalarına yazımızdan göz atabilirsiniz.
Onchain analiz, blockchain piyasalarından elde edilen verilerden oluşur ve sadece borsalara giriş ve çıkışları yansıtır. Bu veriler olumlu veya olumsuz şekilde yorumlanabilir, ancak boğa veya ayı piyasasıyla ilgili kesin bir öngörü içermez. Yukarıda paylaşılan tüm analizler eğitim amaçlıdır, bu gönderi herhangi bir finansal tavsiye içermez.