


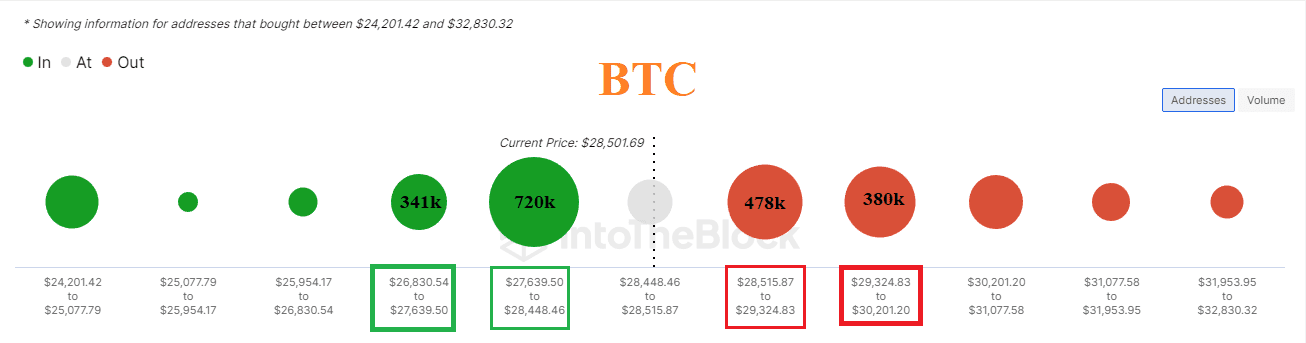
Onchain üzerinde $27640-$28450 aralığından Bitcoin alan kullanıcılar yüksek kârlılıkta görünüyor. $28500-$29325 maliyetli kullanıcılar ise zararda görünüyor. Kırmızı küreler ne kadar büyük , yeşil küreler ne kadar küçük ise yükseliş ihtimali o kadar yükselir. Yeşil küreler ne kadar büyük, kırmızılar küreler ne kadar küçük ise düşüş ihtimali o kadar yükselir. Kürelerin bulunduğu seviye aralıkları güçlü destek ya da güçlü direnç olarak çalışabilir. Kürelerin içindeki değerler, o fiyat aralığında kârda ya da zararda tutulan Bitcoin sayısıdır.
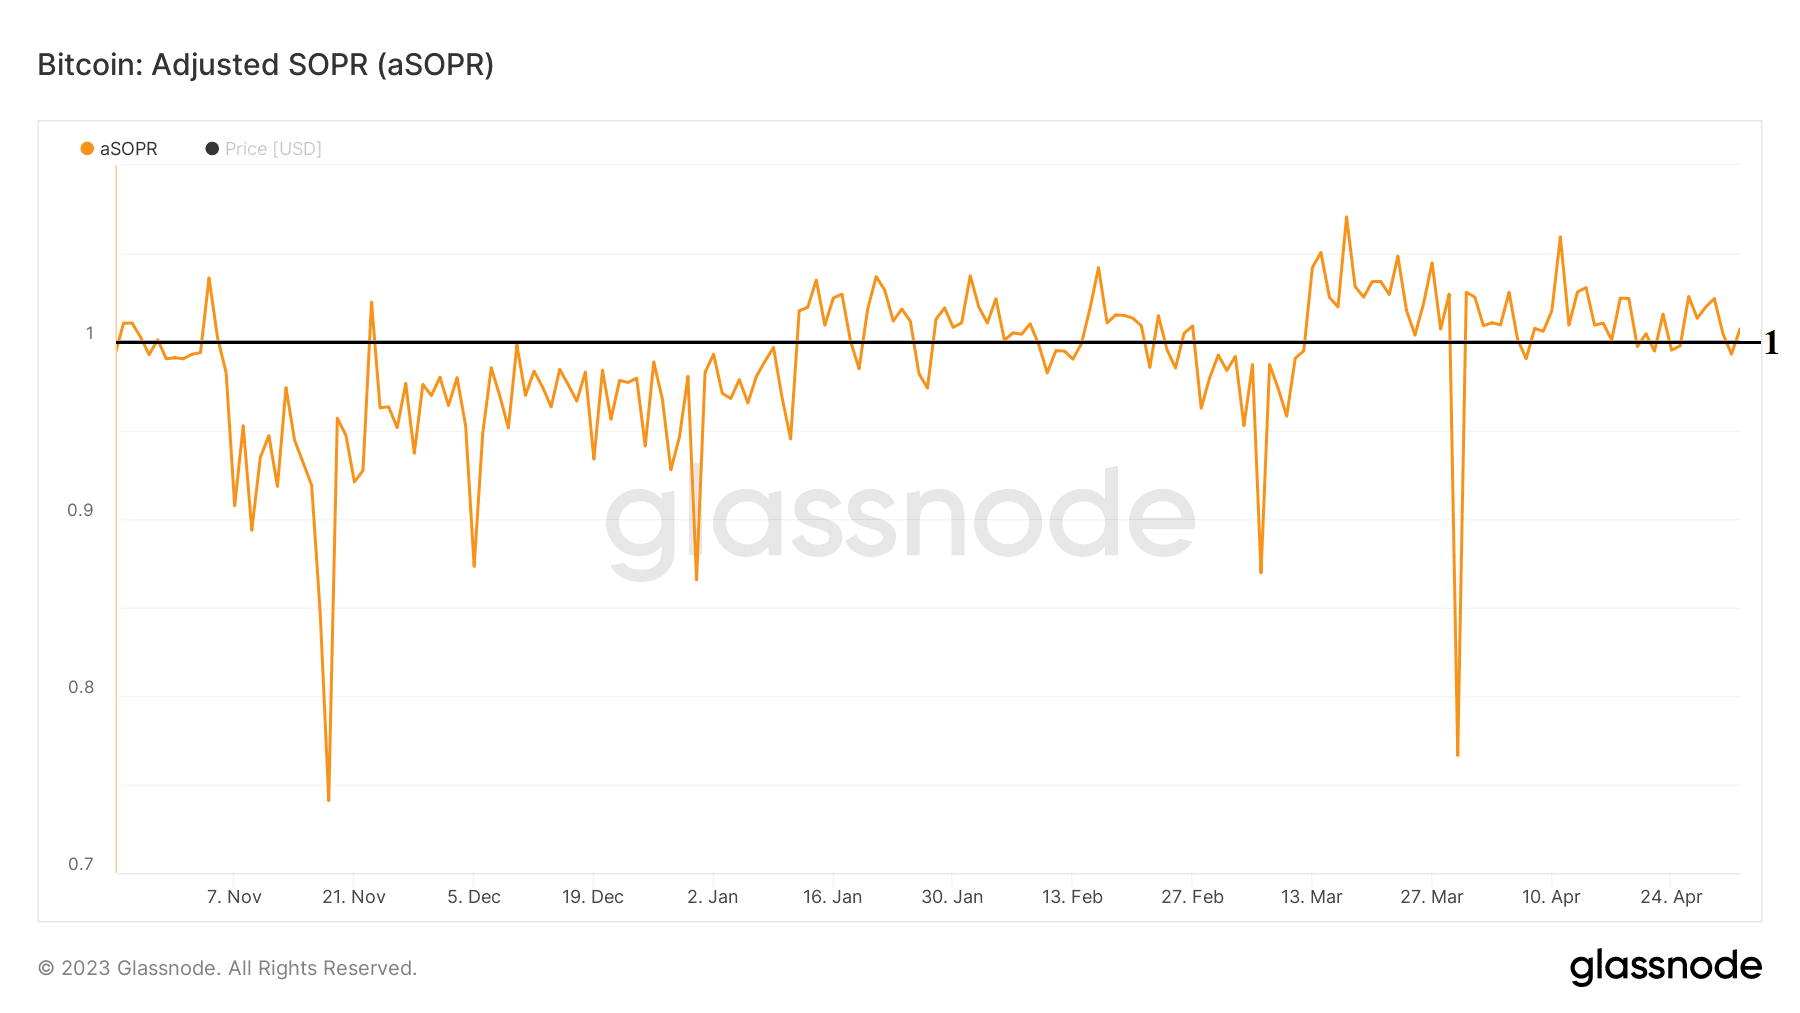
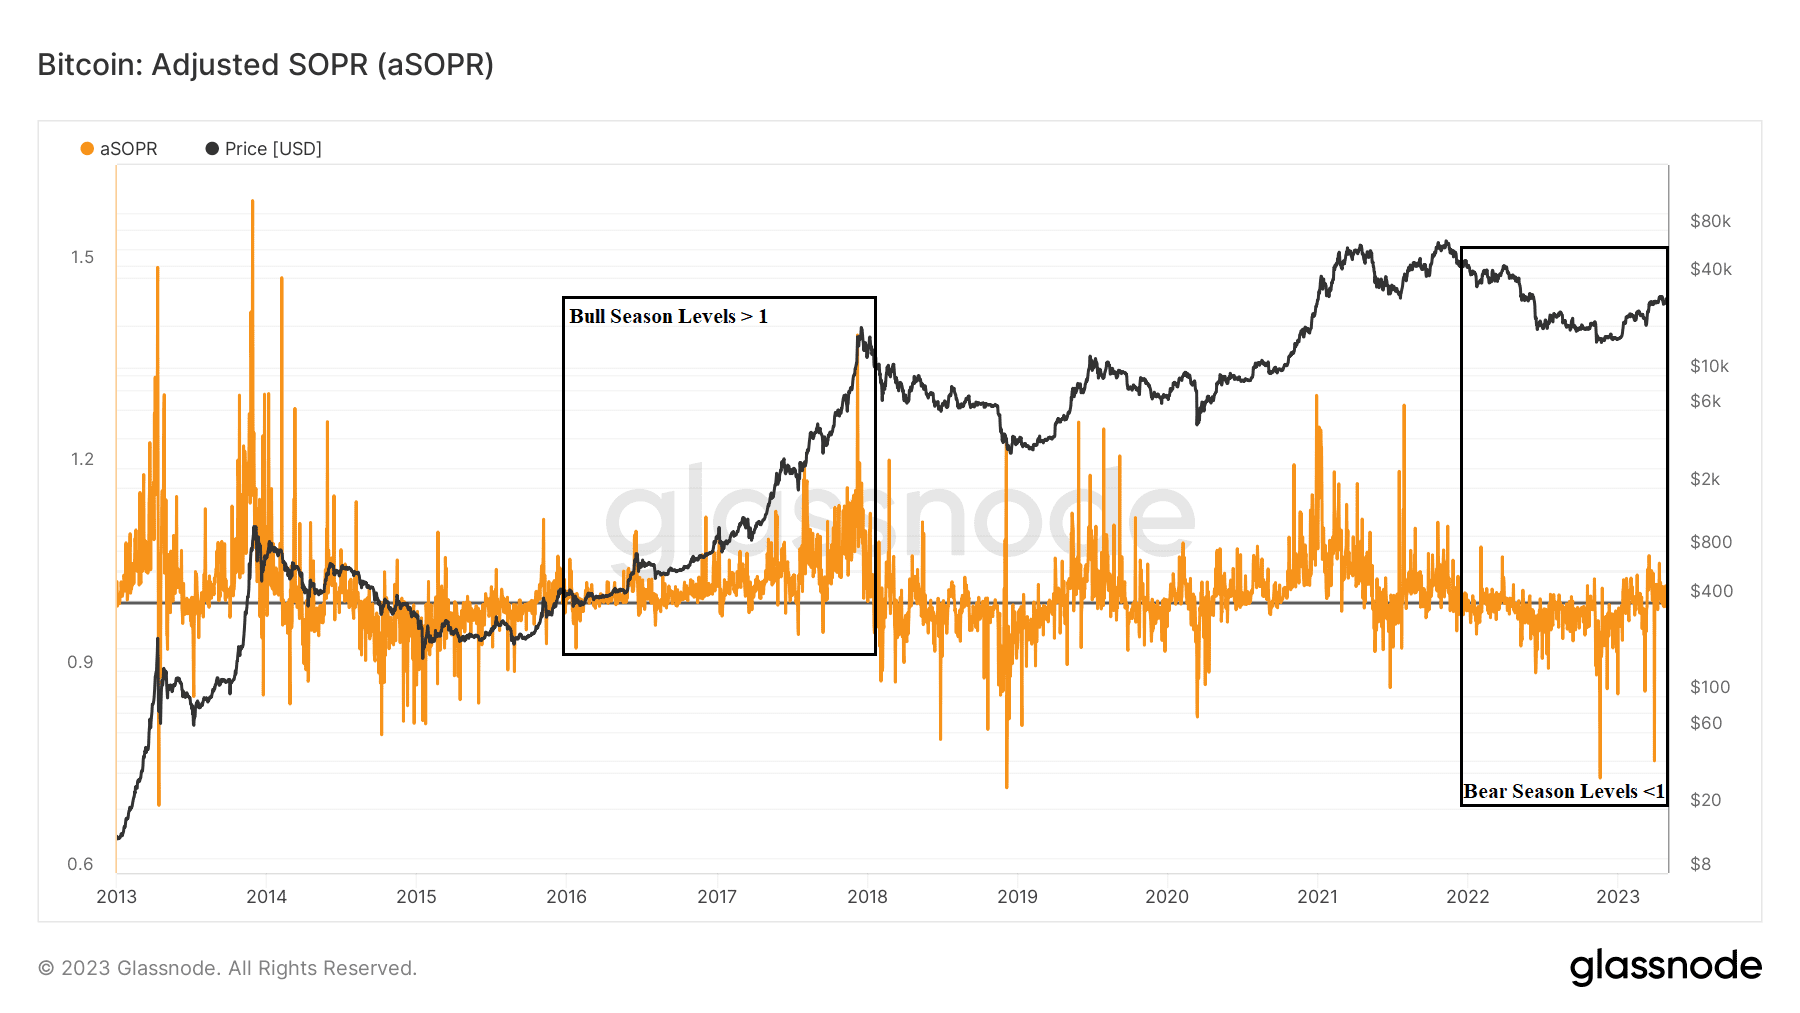
ASOPR verisi boğa sezonlarında çoğunlukla 1 seviyesi ve üzerinde, ayı sezonunda 1 seviyesi ve altında performans göstermiş. Bitcoin boğa sezonunda ise bu verinin 1 seviyesinden yukarıda tutunması gerekir.
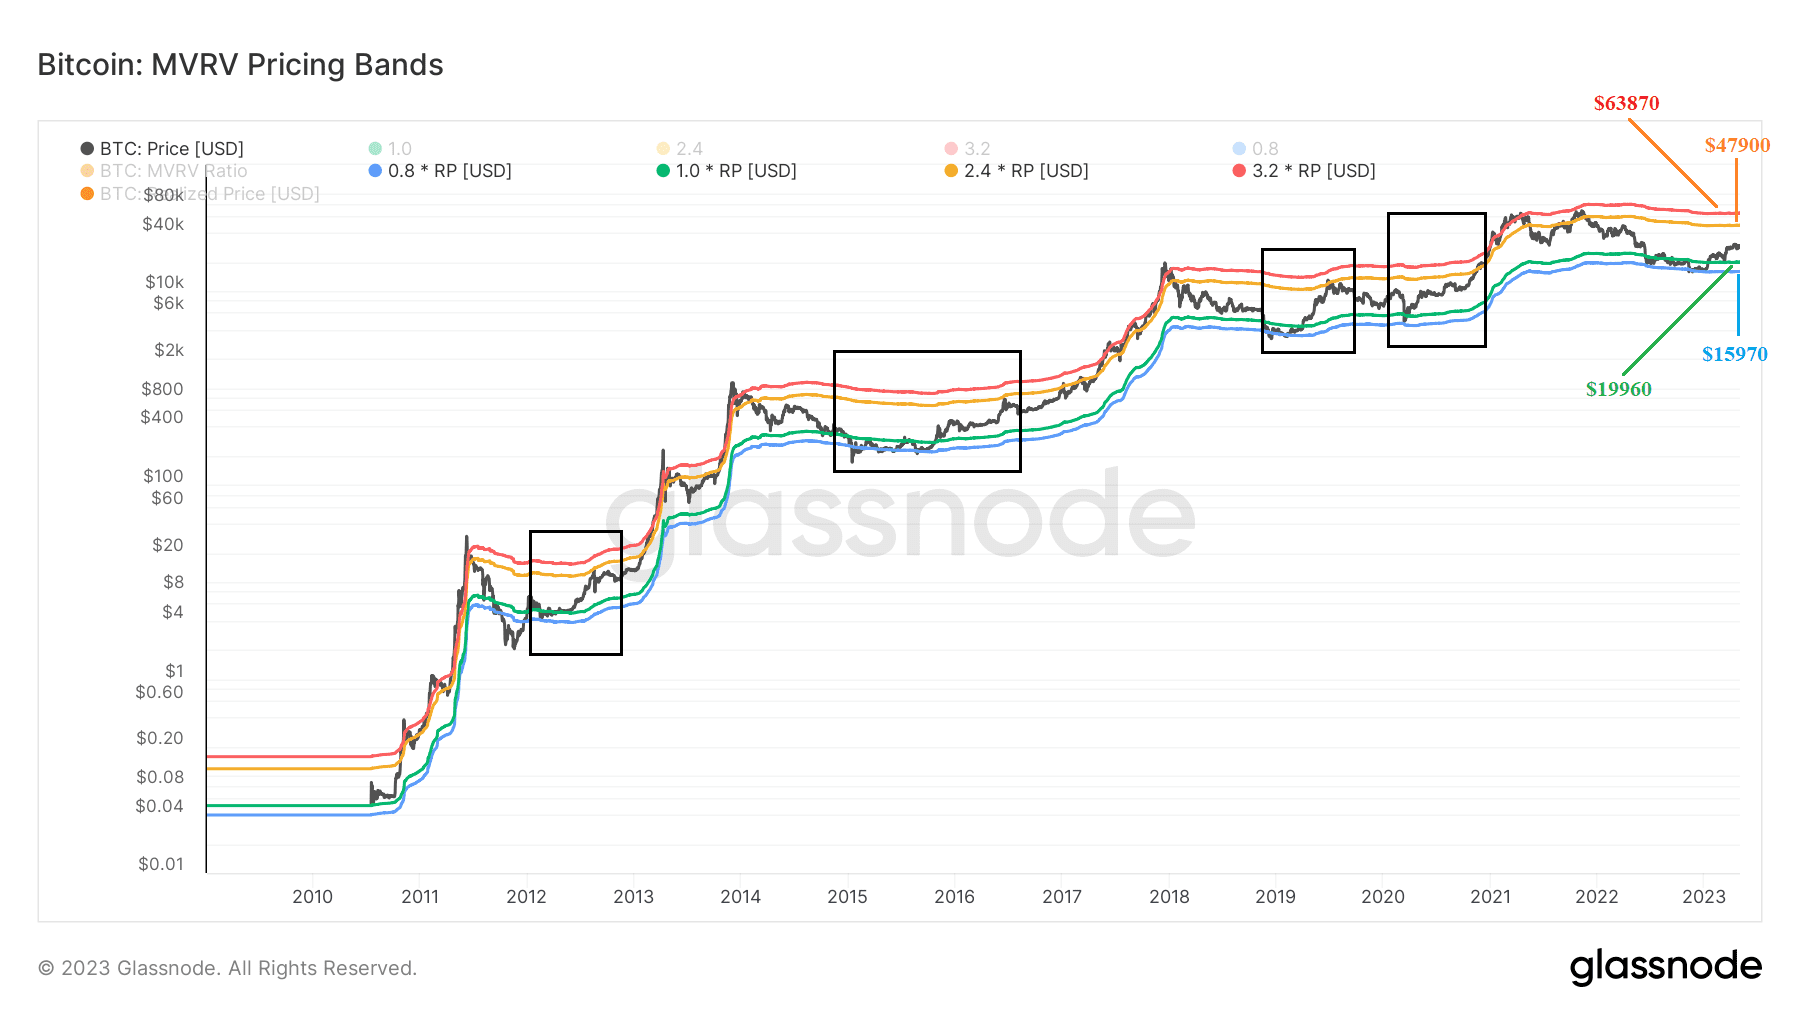
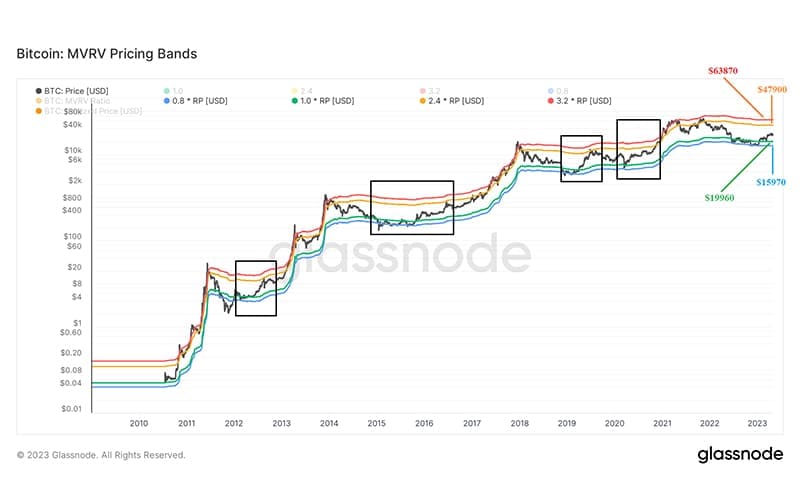
Bitcoin, geçmişte yeşil ve mavi bantlar arasındaki hareketinden sonra yükseliş yaşamış ve ardından turuncu banda kadar yükseliş göstermiş. Kesinlik yok ancak şu anki fiyat hareketi de aynı şekilde olursa bugünkü turuncu direnç $47900. Yeşil destek bandı fiyatı $19960.
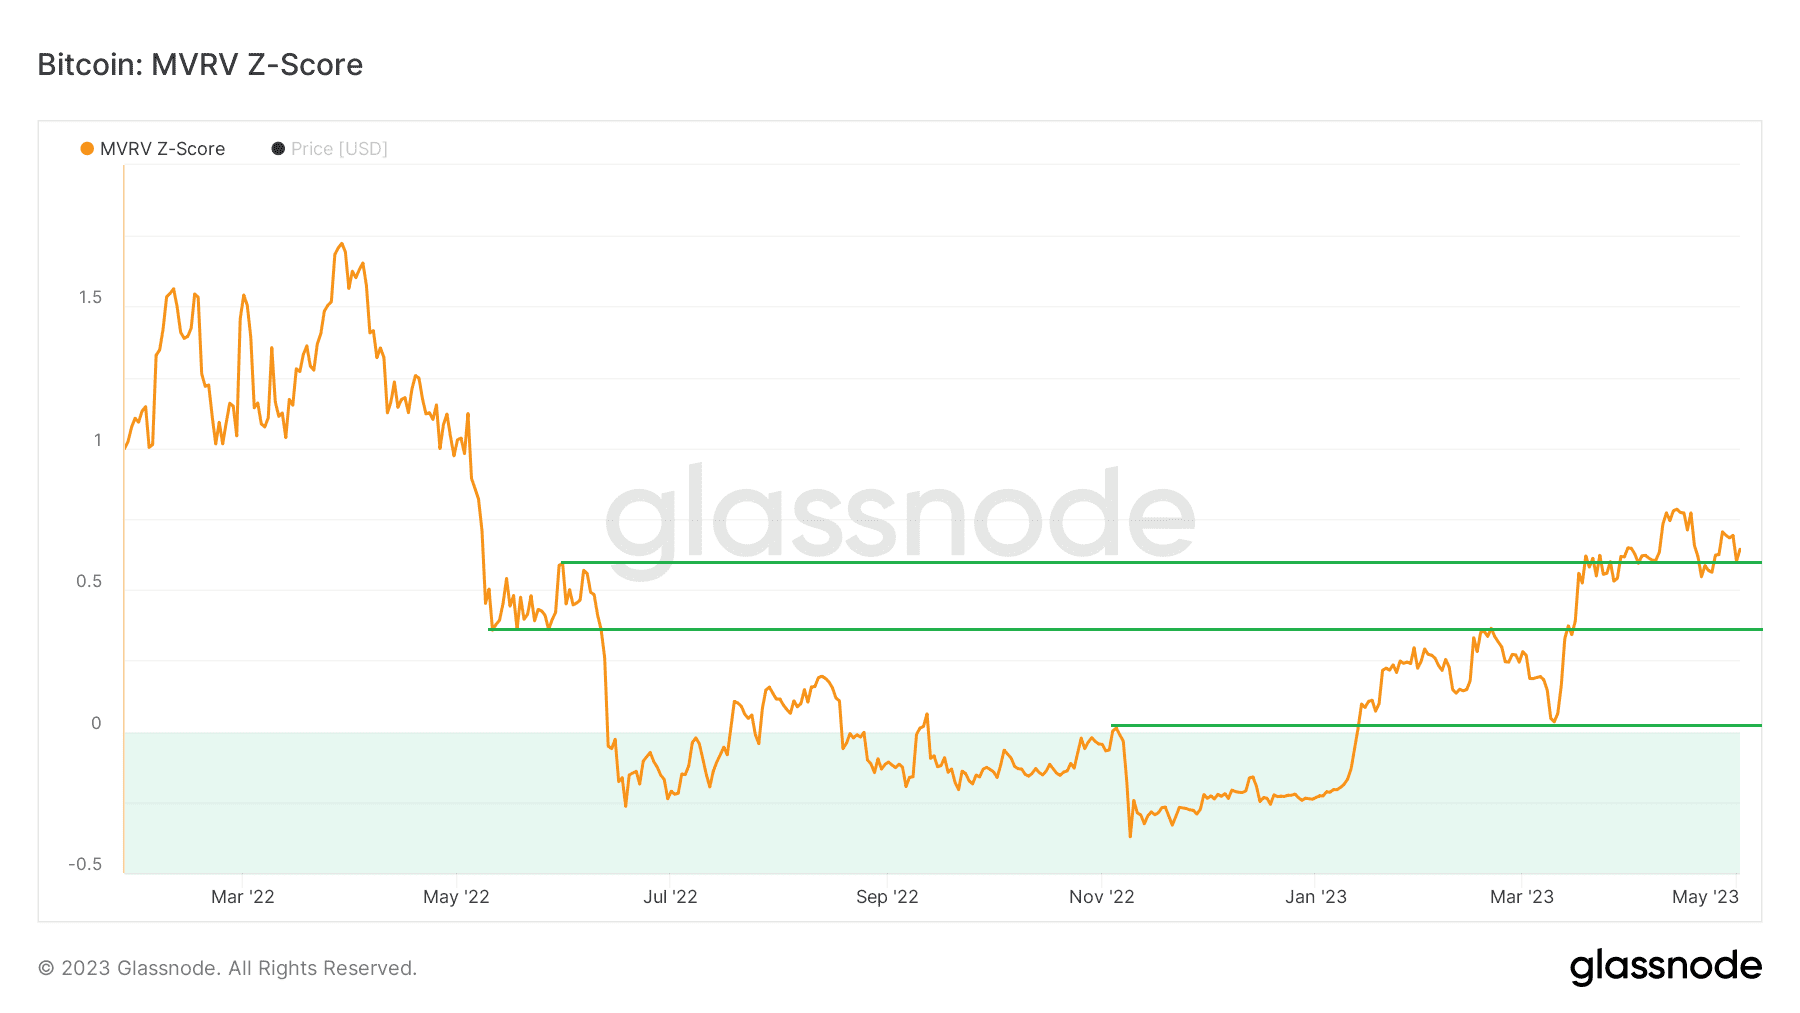
MVRV Z-Skoru, Bitcoin’in “gerçeğe uygun değerine” göre ne zaman fazla ya da az değerli olduğunu değerlendirmek için kullanılır. Piyasa değeri, gerçekleşen değerden önemli ölçüde yüksek olduğunda, tarihsel olarak bir piyasa zirvesini (kırmızı bölge) gösterirken, tersi piyasa diplerini (yeşil bölge) gösterir. Kısa vadede destek bölgesinde tutunmuş görünüyor ancak desteğin kaybedilmesi durumunda bir alt desteği hedefleyebilir, bu da Bitcoinde daha düşük fiyat seviyelerini işaret eder.

Net Unrealized Profit/Loss grafiğinde, sıfırın üzerindeki değerler ağdaki Bitcoin holderlarının ne oranda kârda, sıfırın altındaki değerler ise ne oranda zararda olunduğunu gösterir.
+Kritik seviyeler: 0 / 0.25 / 0.50 / 0.65 / 0.75 ve üzeri
0 altı : Kapitülasyon
0-0.25 aralığı : Umut/Korku
0.25-0.5 aralığı : İyimserlik/Endişe
0.5-0.75 aralığı : İnanç/İnkar
0.75 ve üzeri : Coşku/Açgözlülük
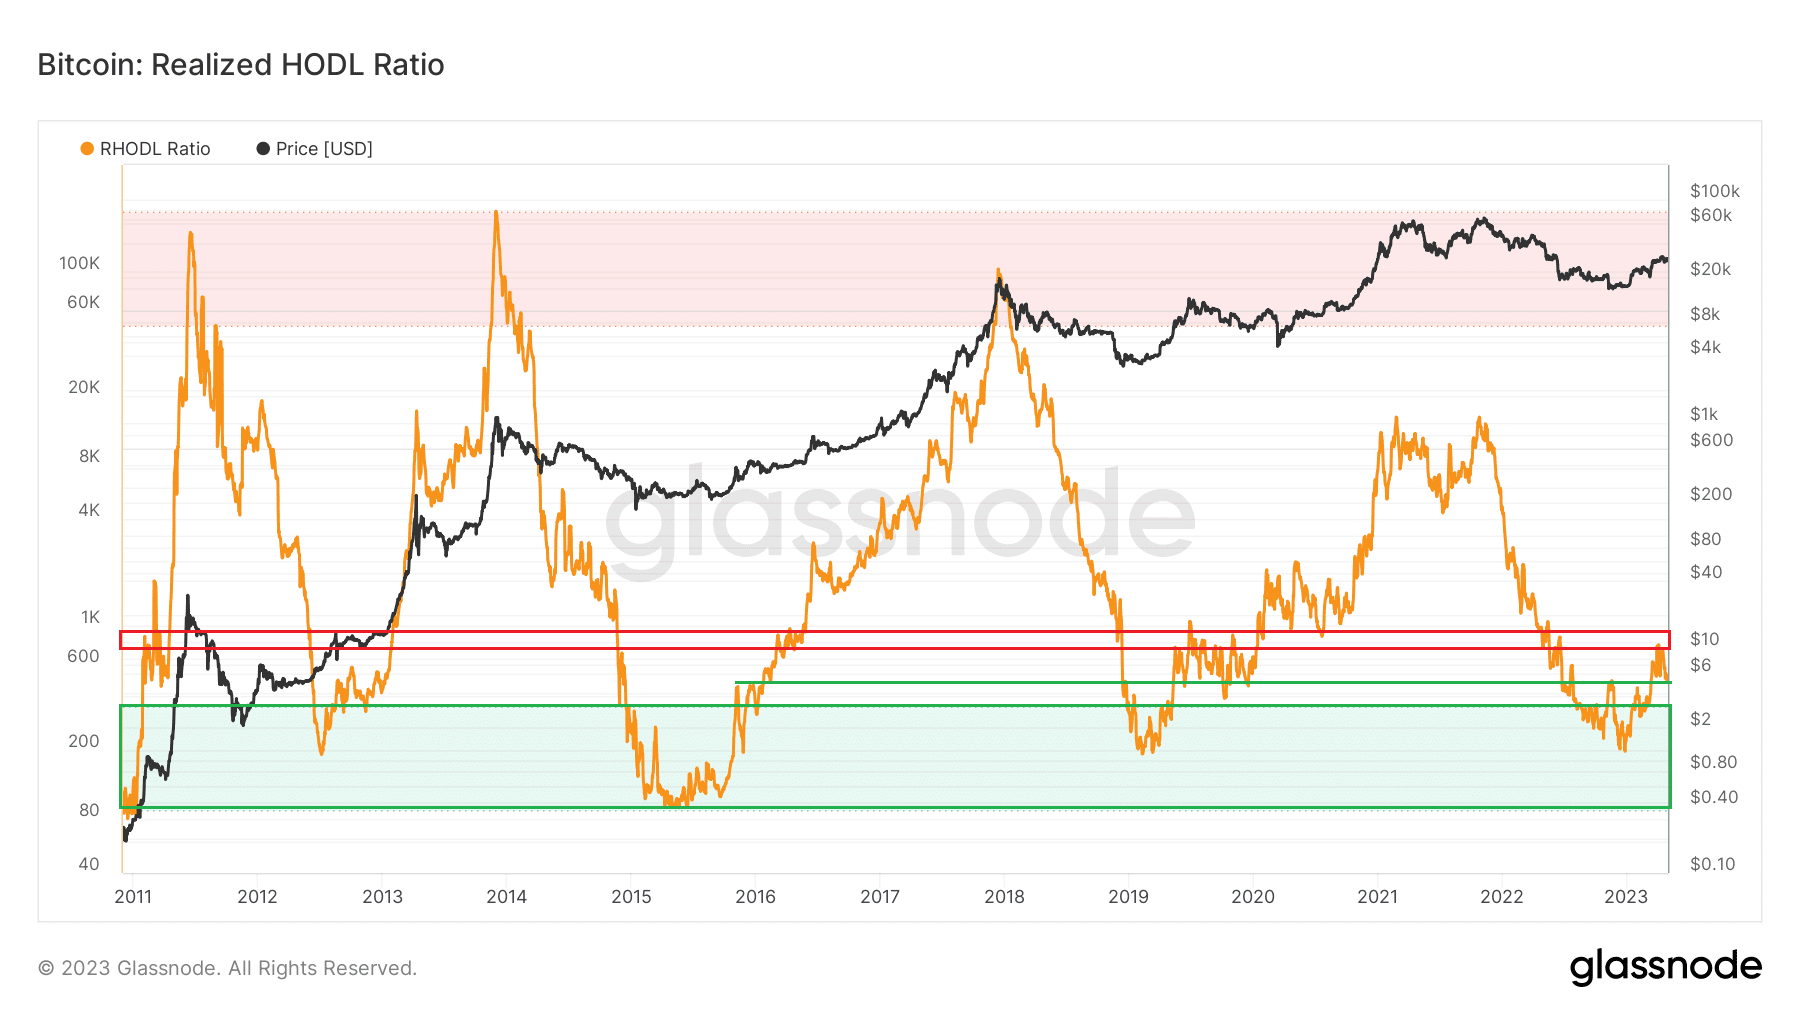
Yüksek Rhodl ratio oranı , aşırı ısınmış (şişmiş) bir marketi temsil eder ve düşüş riski taşır. Düşük Rhodl ratio oranı , aşırı satışa uğramış bir marketi temsil eder ve yükseliş ihtimali oluşturabilir. Bitcoin, kısa vade için destek bölgesinde tutunmuş görünüyor.
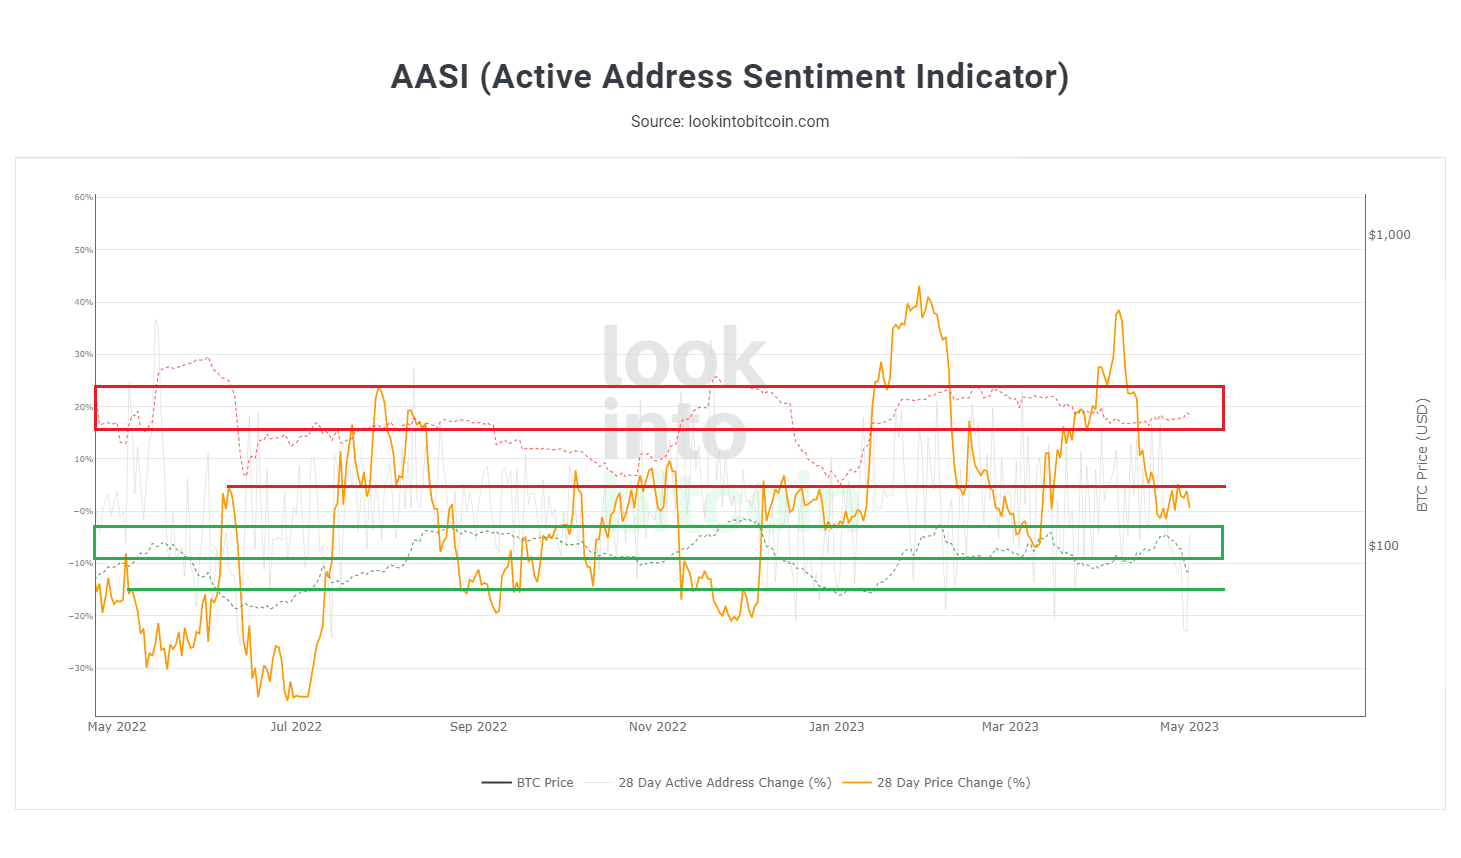
The Active Address Sentiment Indicator verisi, bir önceki söylediğimiz bant ortası direnç bölgesinden düşüş yaşamış gibi görünüyor. Genel olarak Bitcoin fiyatı şu an ara bir değerde ve kararsız duruyor. Düşüş devam ederse önemli fiyat seviyeleriyle birlikte destek bölgesini takip edeceğiz.
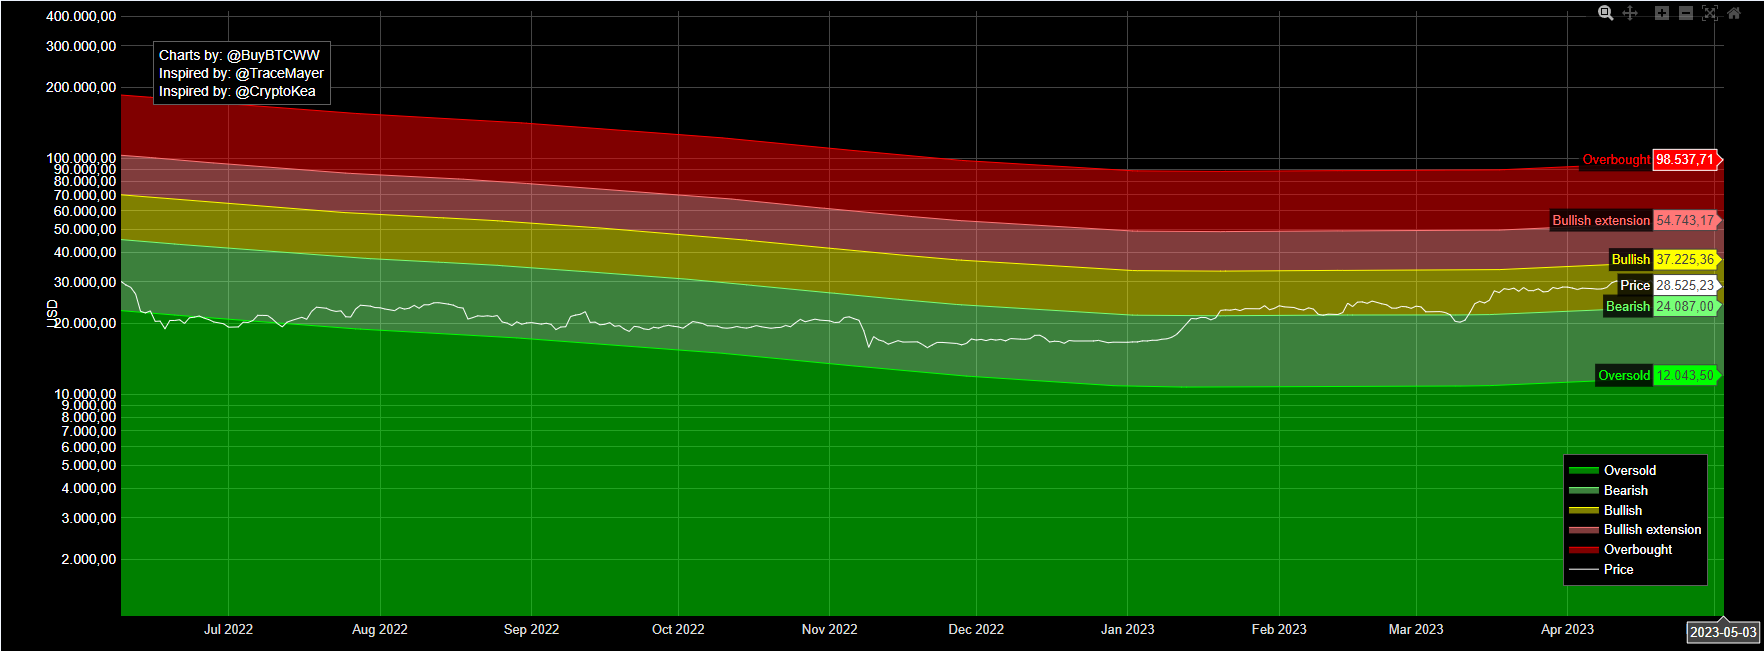
Bitcoinin bullish yapısını koruması için tutunması gereken seviye $24087. Daha da sert yükselişler yapabilmesi için $37225 seviyesini aşması beklenir. Tekrar derin bir ayı sezonu yaşanması durumunda izleyeceğimiz destek seviyesi $12043.
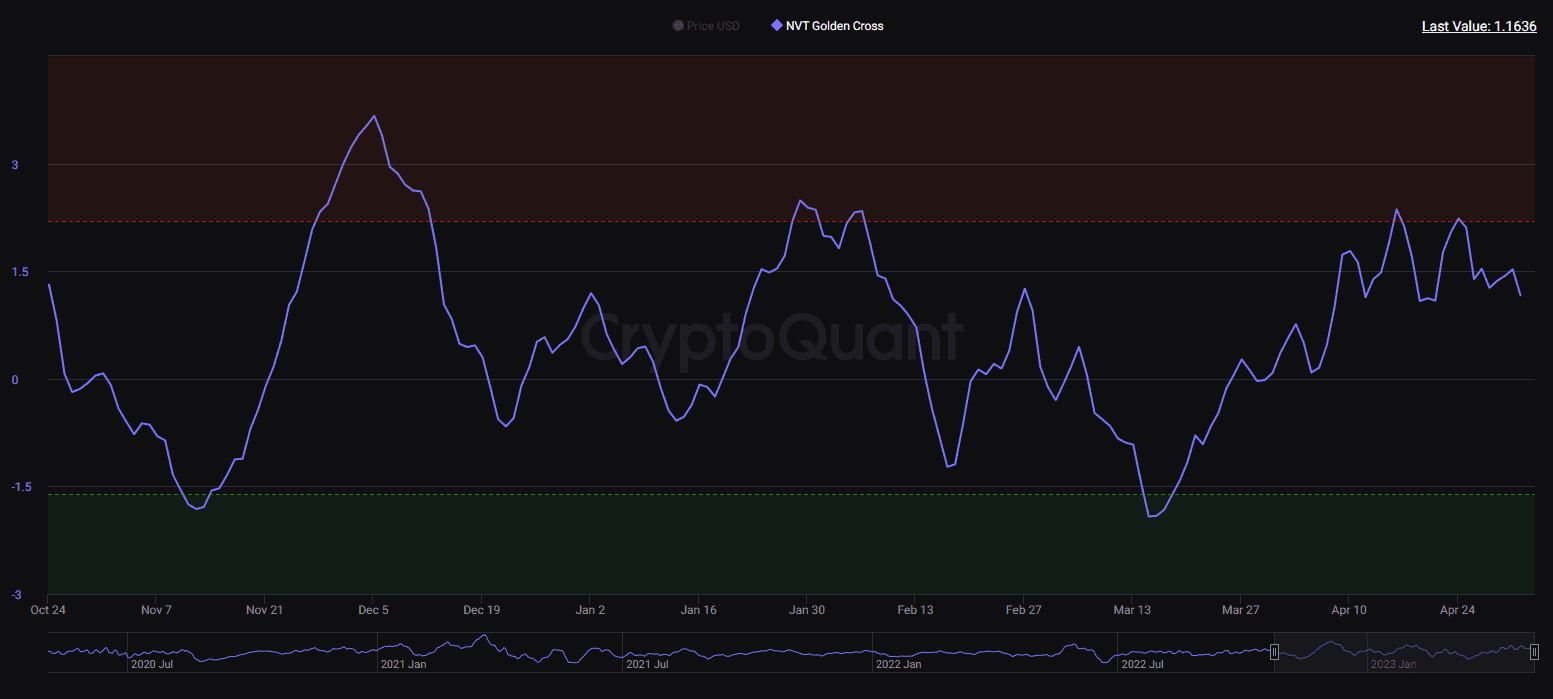
NVT Golden Cross yeniden risk bölgesinden tepki almış gibi görünüyor. Verinin sert düşüşü fiyat düşüşünü daha da fazla tetikleyebilir.
Onchain verileri ve açıklamalarına buradan göz atabilirsiniz.
Onchain analiz, blockchain piyasalarından elde edilen verilerden oluşur ve sadece borsalara giriş ve çıkışları yansıtır. Bu veriler olumlu veya olumsuz şekilde yorumlanabilir, ancak boğa veya ayı piyasasıyla ilgili kesin bir öngörü içermez. Yukarıda paylaşılan tüm analizler eğitim amaçlıdır, bu gönderi herhangi bir finansal tavsiye içermez.