


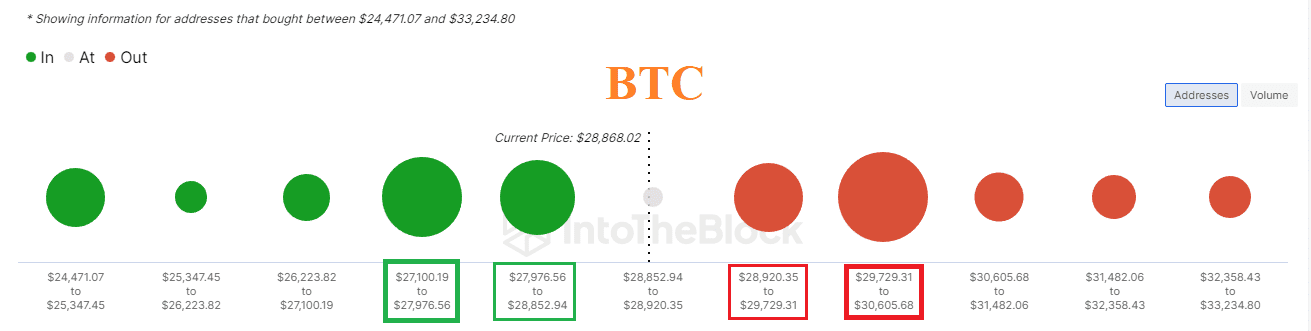

Onchain üzerinde 29700$-30600$ aralığından bitcoin alan kullanıcılar yüksek zararda görünüyor. 27975$-28850$ aralığından bitcoin alan kullanıcıların kar durumları ise oldukça iyi durumda. Kırmızı küreler ne kadar büyük , yeşil küreler ne kadar küçük ise yükseliş ihtimali o kadar yükselir. Yeşil küreler ne kadar büyük, kırmızılar küreler ne kadar küçük ise düşüş ihtimali o kadar yükselir. Kürelerin bulunduğu seviye aralıkları güçlü destek ya da güçlü direnç olarak çalışabilir. Şu anki aşamada bitcoin karar vermeye çalışıyor gibi görünüyor.
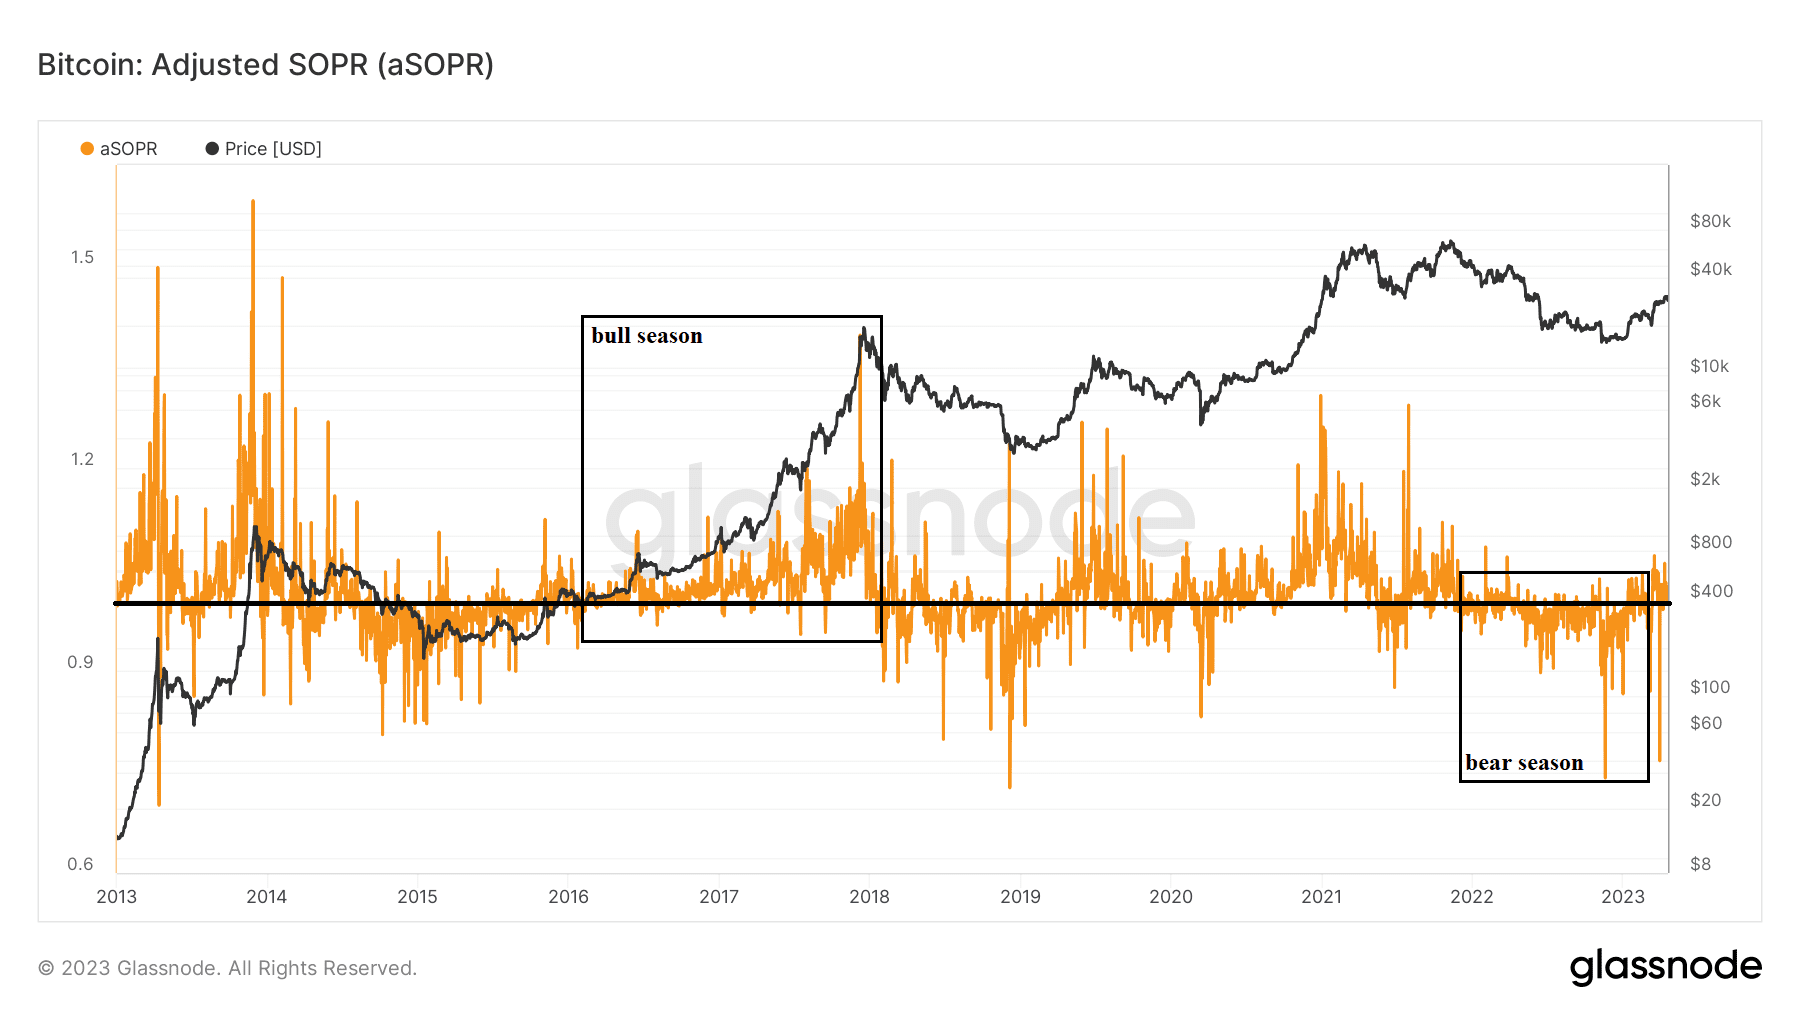
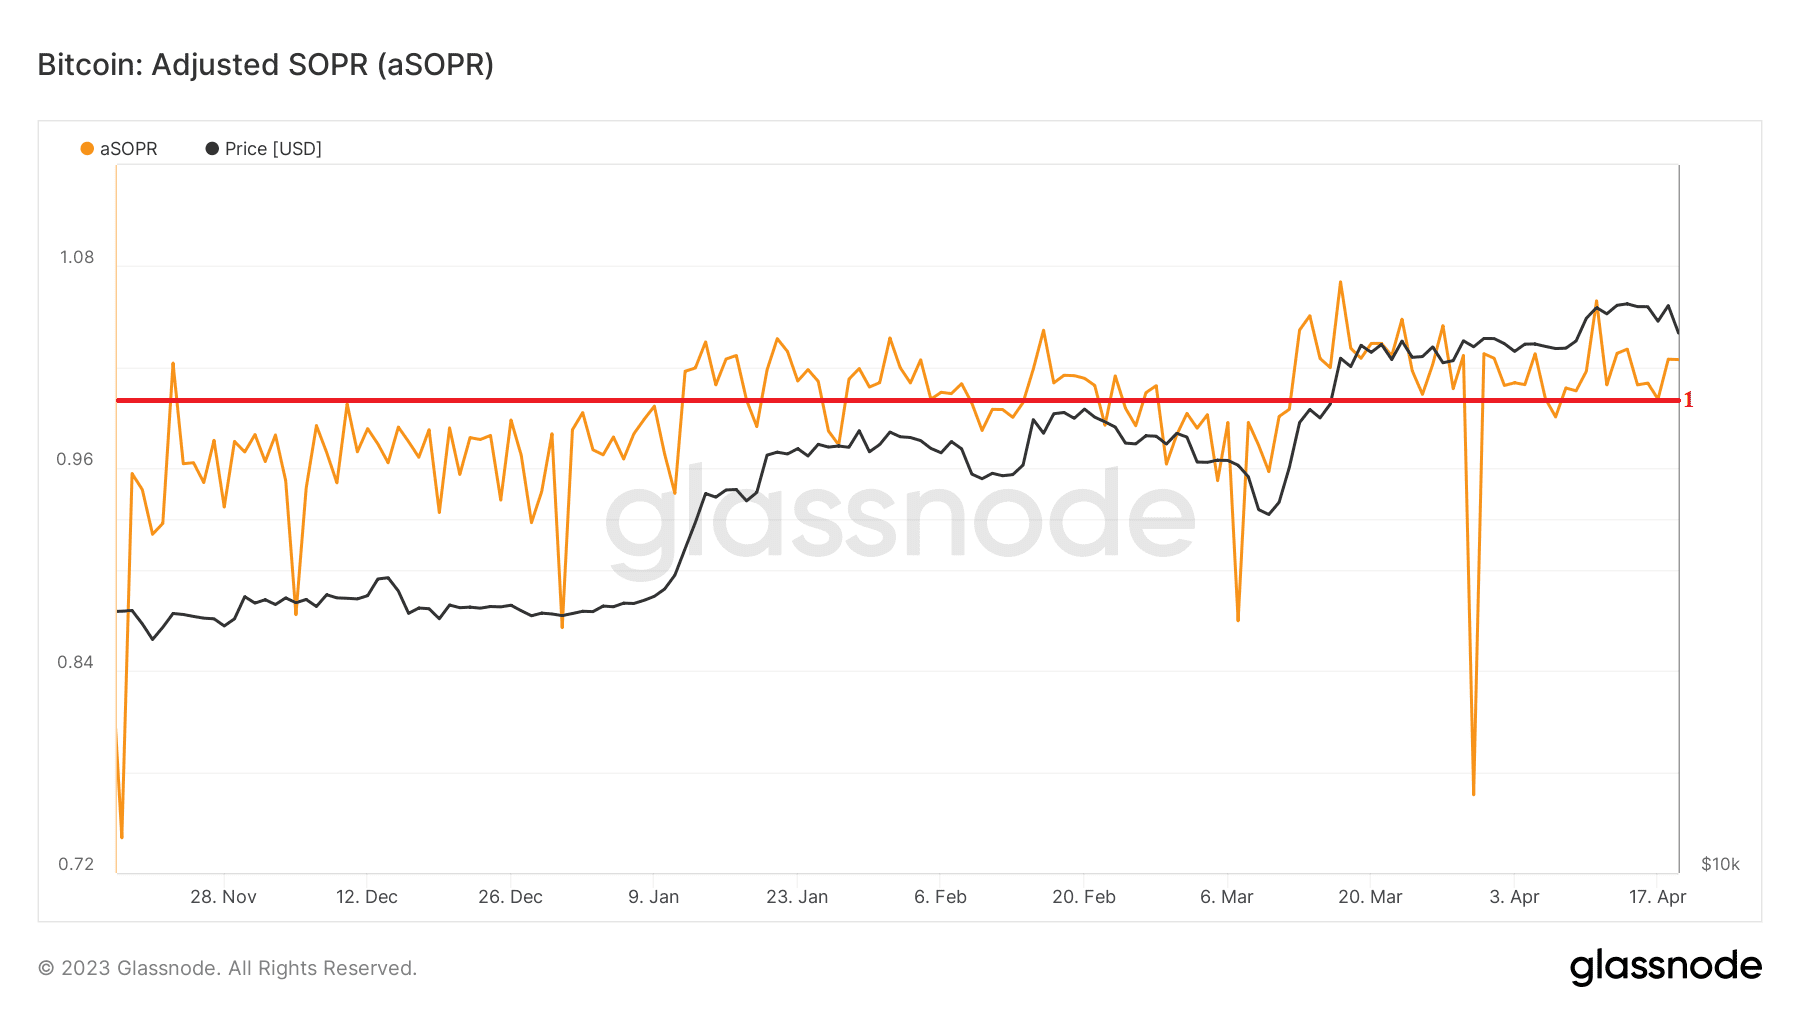
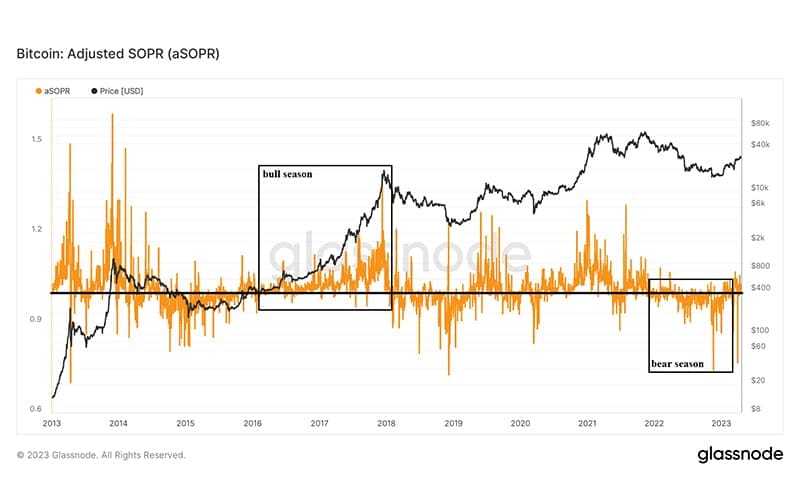
ASOPR verisi boğa sezonlarında çoğunlukla 1 seviyesi ve üzerinde, ayı sezonunda 1 seviyesi ve altında performans göstermiş. Bitcoin boğa sezonunda ise bu verinin 1 seviyesinden yukarıda tutunması gerekir.
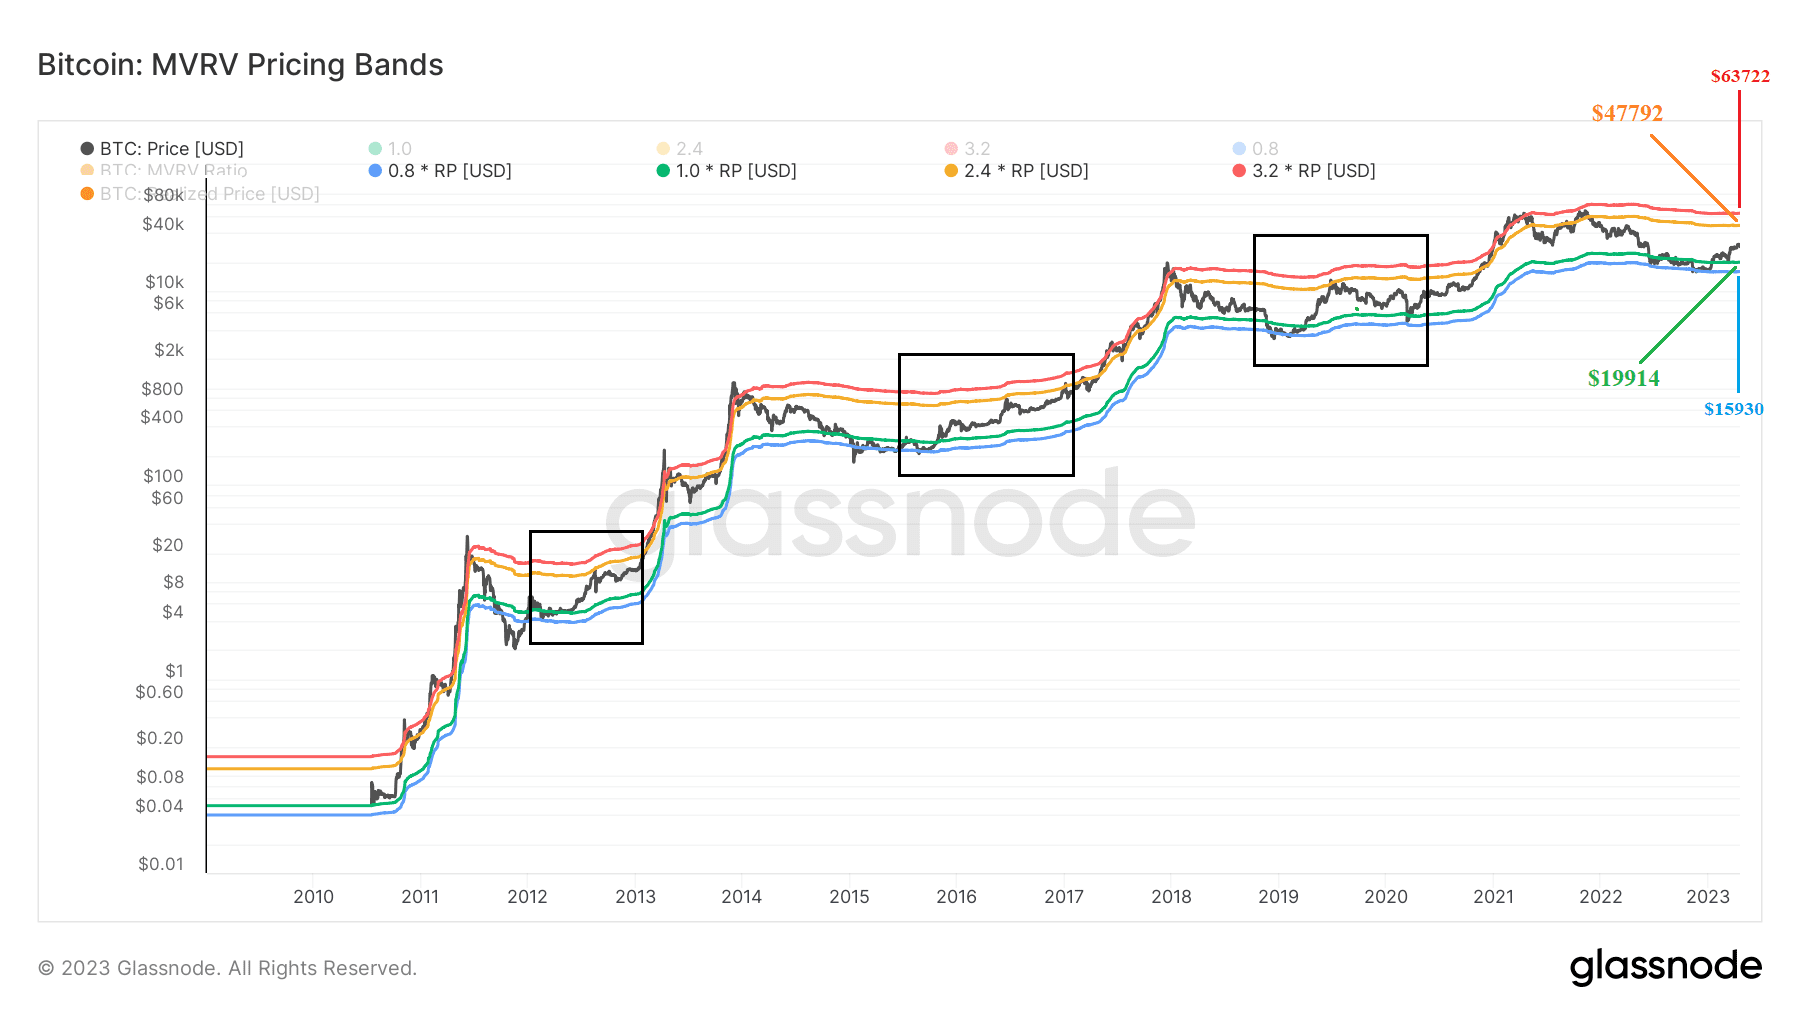
Bitcoin, geçmişte yeşil ve mavi bantlar arasındaki hareketinden sonra yükseliş yaşamış ve ardından turuncu banda kadar yükseliş göstermiş. Kesinlik yok ancak şu anki fiyat hareketi de aynı şekilde olursa bugünkü turuncu direnç 47792$.
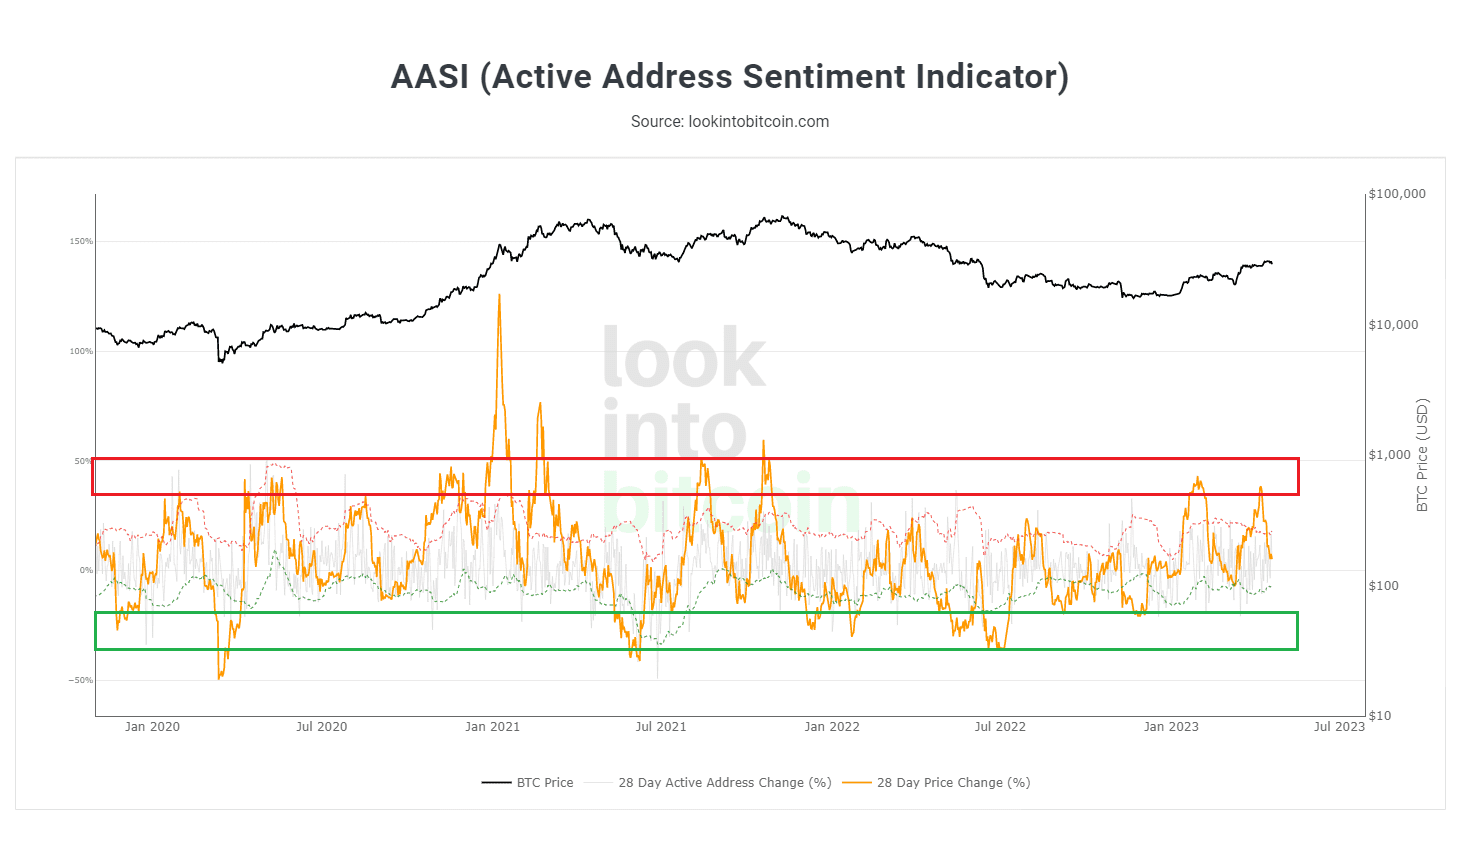
Active Address Sentiment Indicator verisi, destek ve direnç bantlarının orta noktasında. Ana destek bölgesi daha da aşağıda. Düşüşün derinleşmesi durumunda bu veride o bölgeye gitmeyi hedefleyebilir.
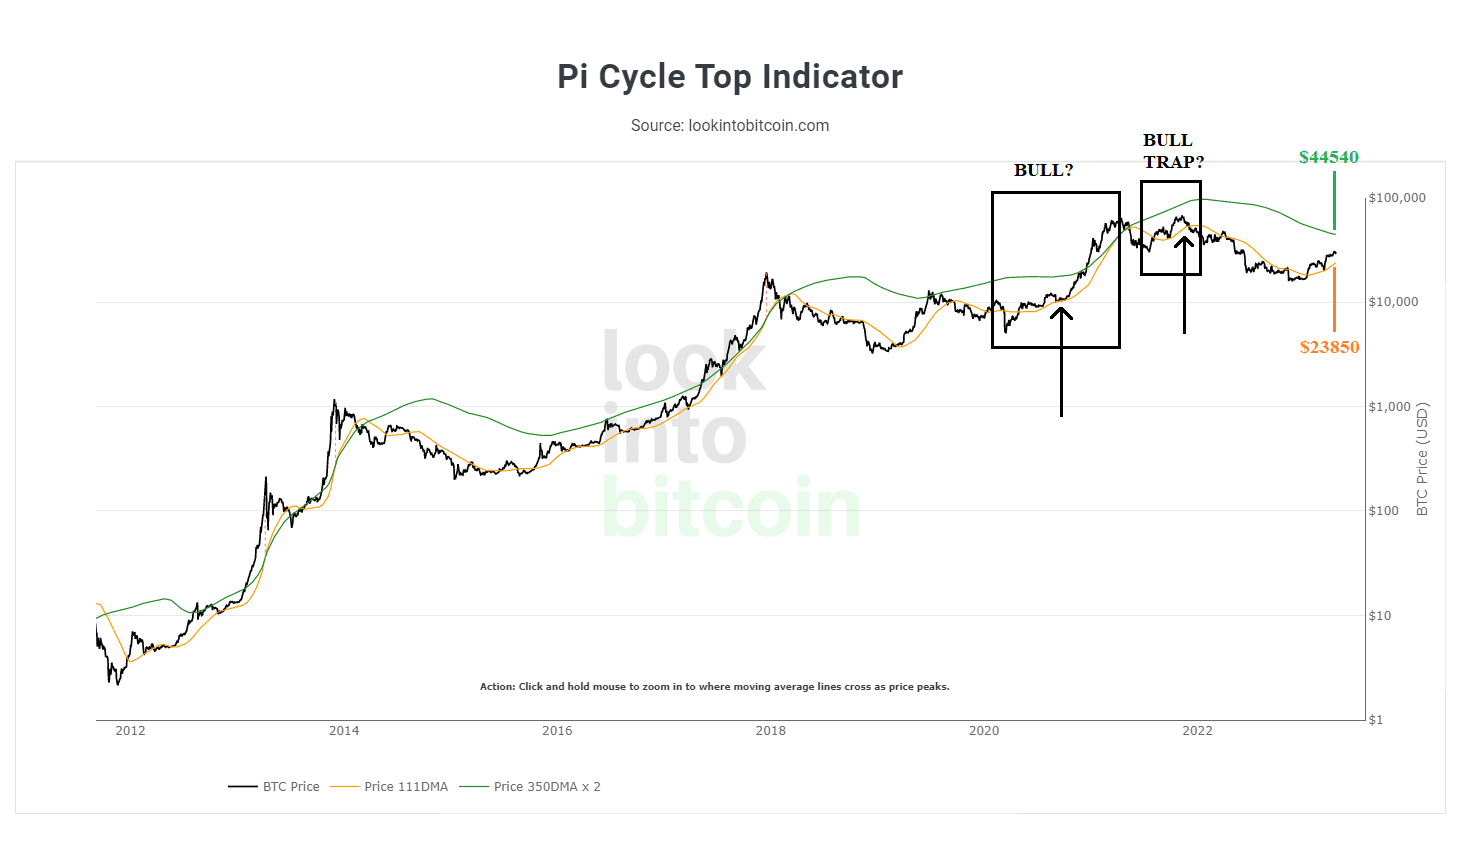
Bitcoin, geçmişte turuncu bant altındaki fiyat hareketinden sonra kendini turuncu bandın üstüne atarak yükseliş yaşamış. 2016-2018 yıllarında yeşil bant ve turuncu bant paralel olarak birlikte yükselmiş ve boğa sezonu yaşanmış. Ancak 2019-2020 yılları arasında Yeşil bant güçlü bir direnç olmuş ve ayı sezonu yaşanmış. Şu anki grafiğe göre turuncu bant desteği 23850$, yeşil bant direnci 44540$.
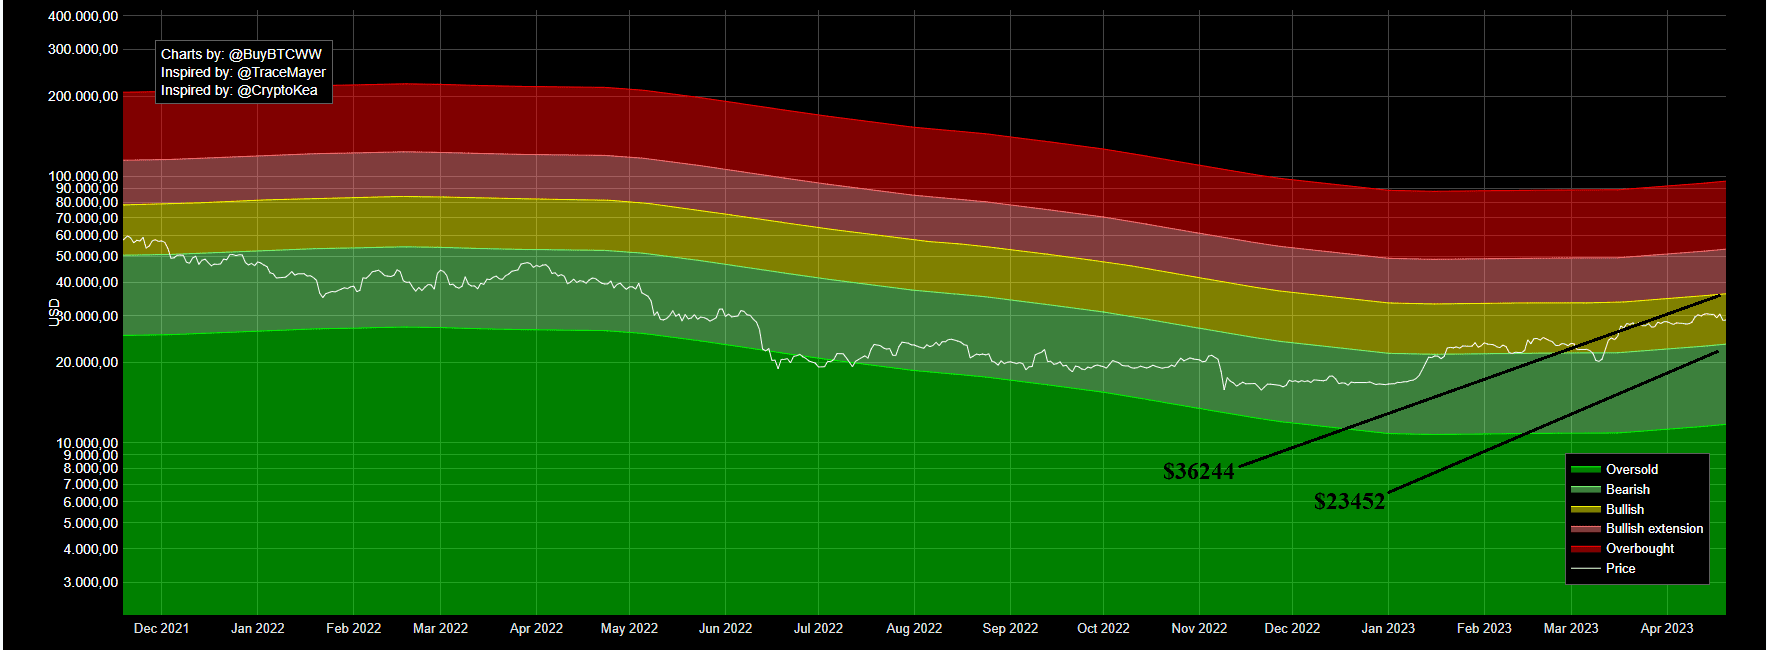
Bitcoinin bullish yapısını koruması için tutunması gereken seviye 23452$. Daha da sert yükselişler yapabilmesi için 36244$ seviyesini aşması beklenir.
Onchain verileri ve açıklamalarına göz atabilirsiniz.
Onchain analiz, blockchain piyasalarından elde edilen verilerden oluşur ve sadece borsalara giriş ve çıkışları yansıtır. Bu veriler olumlu veya olumsuz şekilde yorumlanabilir, ancak boğa veya ayı piyasasıyla ilgili kesin bir öngörü içermez. Yukarıda paylaşılan tüm analizler eğitim amaçlıdır, bu gönderi herhangi bir finansal tavsiye içermez.