


Amerika Birleşik Devletleri’ndeki ekonomik durum yöneticilerin söylediğinin aksine kötüye gitmeye devam ediyor. ABD hazine bakanı Janet Yellen katıldığı bir toplantıda, büyük banka yöneticilerine, batan bankalar ve batacak bankalarla ilgili “İleri dönemde daha fazla banka birleşmesi gerekebilir.” şeklinde açıklamalarda bulundu.
Bu sırada bankalar battıktan sonra, batan bankaları kurtarmak için dağıtılan paranın 3/4’ü geri alınmış durumda.
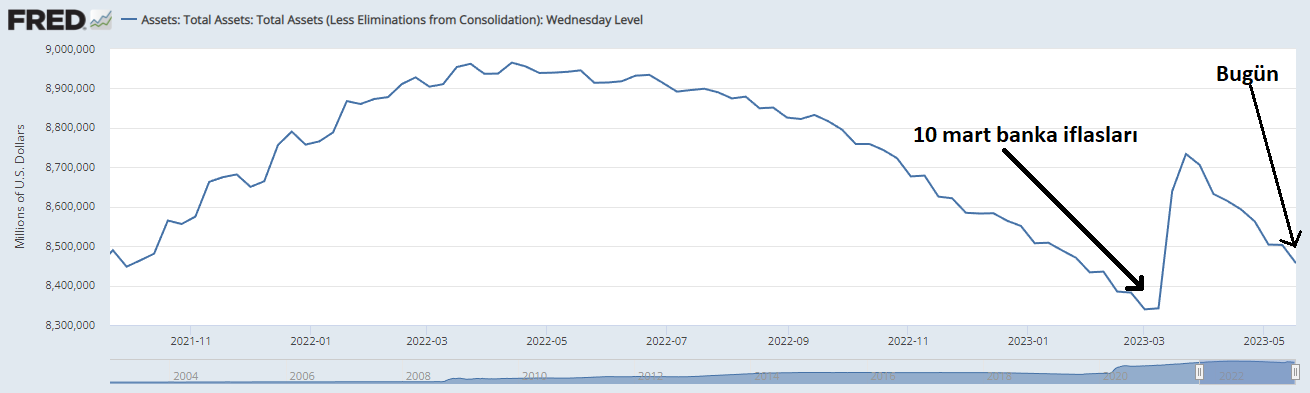
Grafiğe buradan göz atabilirsiniz.
Mevduat Kaçışı
Amerika halkı batan bankaların kurtulacağını ya da başka bir bankanın batmayacağına güvenmiyor. Bunun kanıtı ise bankalardaki durmaksızın devam eden mevduat kaçışı. İnsanlar bankalarda bulunan varlıklarını bankalardan çekmeye devam ediyorlar.
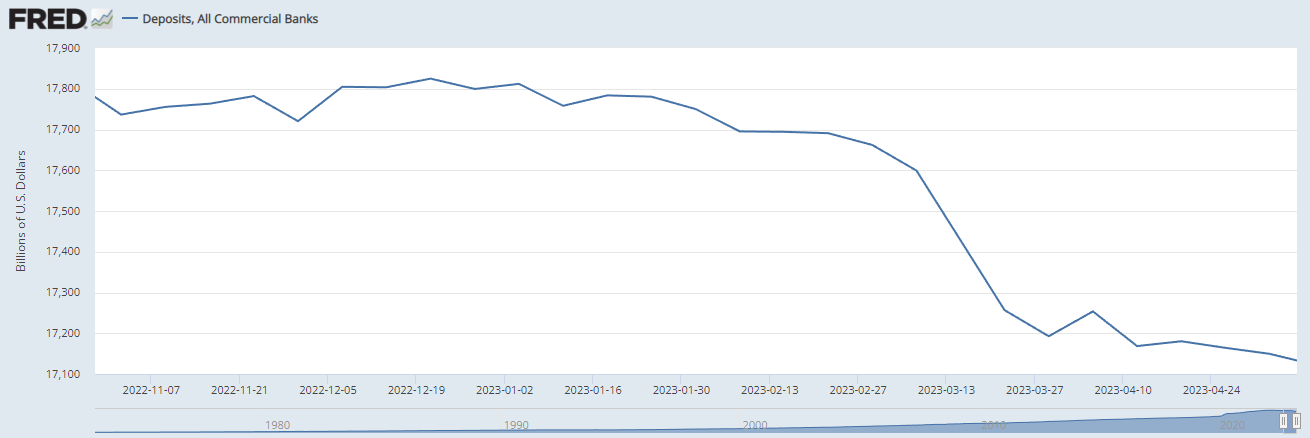
Grafiğe buradan göz atabilirsiniz.
Resesyon İhtimali
New York Federal Rezerve Bankasının mayıs ayı içinde yayınladığı bir istatistiğe göre, Amerika Birleşik Devletleri ekonomisinin resesyona girme ihtimali 68.2214%. 2008 büyük emlak krizinde bu oran yaklaşık ~41%, 2020 korona krizinde ise bu oran yaklaşık ~38% değerlerindeydi.
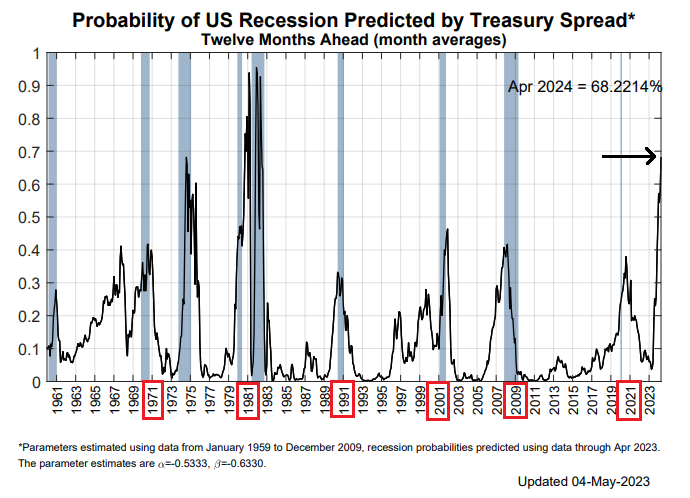
Grafiğe buradan göz atabilirsiniz.
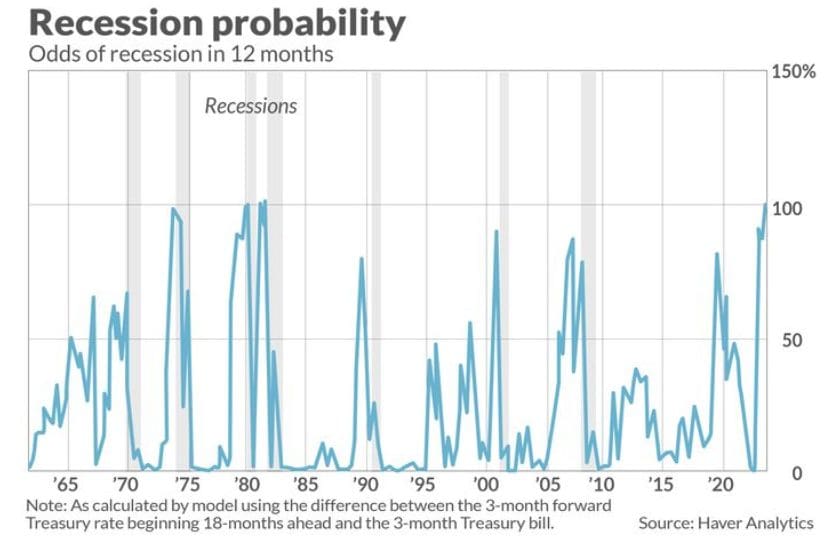
FED’in resesyon ihtimalini hesaplamak için kullandığı sistemin yer aldığı, Haver Analytics şirketinin yayınladığı belgede ise bu oran 99.3%
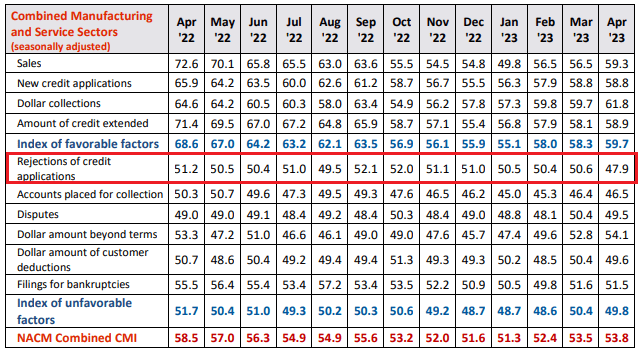
Kredi Reddedilmeleri ve Kredi Talepleri
Kredi reddetmeleri konusunda ise 47.9 ile 2009’dan bu yana en düşük değere ulaşıldı. Amerika ekonomisi yöneticileri herhangi bir sorun yok demelerine rağmen gelen kredi taleplerini reddetmeye devam ediyor.
Grafiğe buradan göz atabilirsiniz.
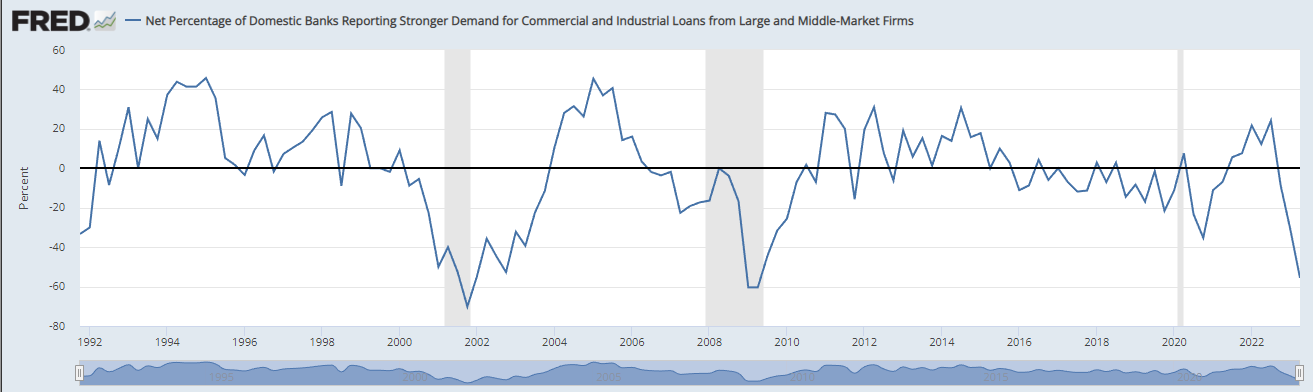
Aksine, orta ve büyük ölçekli bankalardan herhangi bir kredi talebi gelmiyor. Aşağıdaki veri orta ve büyük ölçekli bankalardan gelen kredi taleplerini gösteriyor. Bugünkü güncel değer 2020 korona krizi değerinden kötü, 2001 ve 2008’deki kriz değerlerine ise çok yaklaşmış durumda. Bu ölçekteki bankalar krizlerden sonra büyük sorunlar yaşıyorlar ve çok fazla kredi talebinde bulunuyorlar. Grafikte de görüldüğü üzere bu talep artışından sonra veri yukarı doğru ilerlemeye başlıyor.
Grafiğe buradan göz atabilirsiniz.
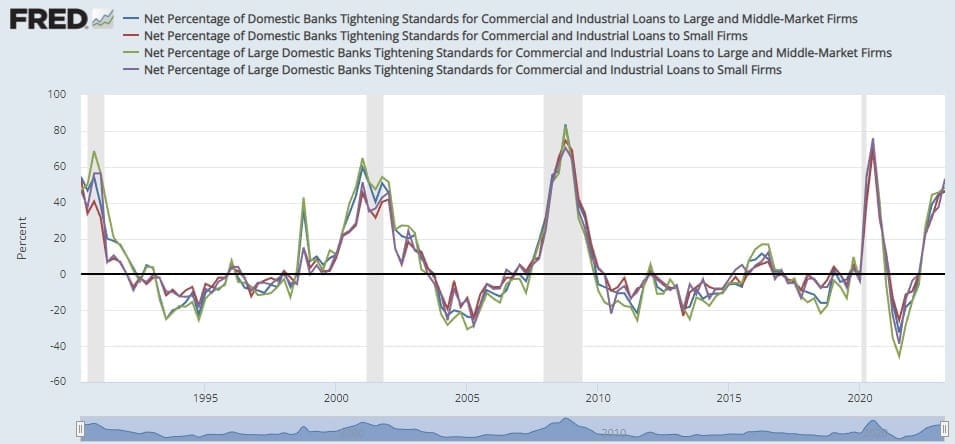
FED yönetimi çok az miktarda olan kredi taleplerini bile reddediyor, ek olarak kredi verme koşullarını ile sıkılaştırmaya devam ediyor. Kredi standartlarını sıkılaştırma konusunda bugünkü gelinen değer 46.7. 2001 krizinde bu değer ortalama 60’a, 2008 ve 2020 krizlerinde bu değer ortalama 70’e ulaşmış.
Grafiğe buradan göz atabilirsiniz.
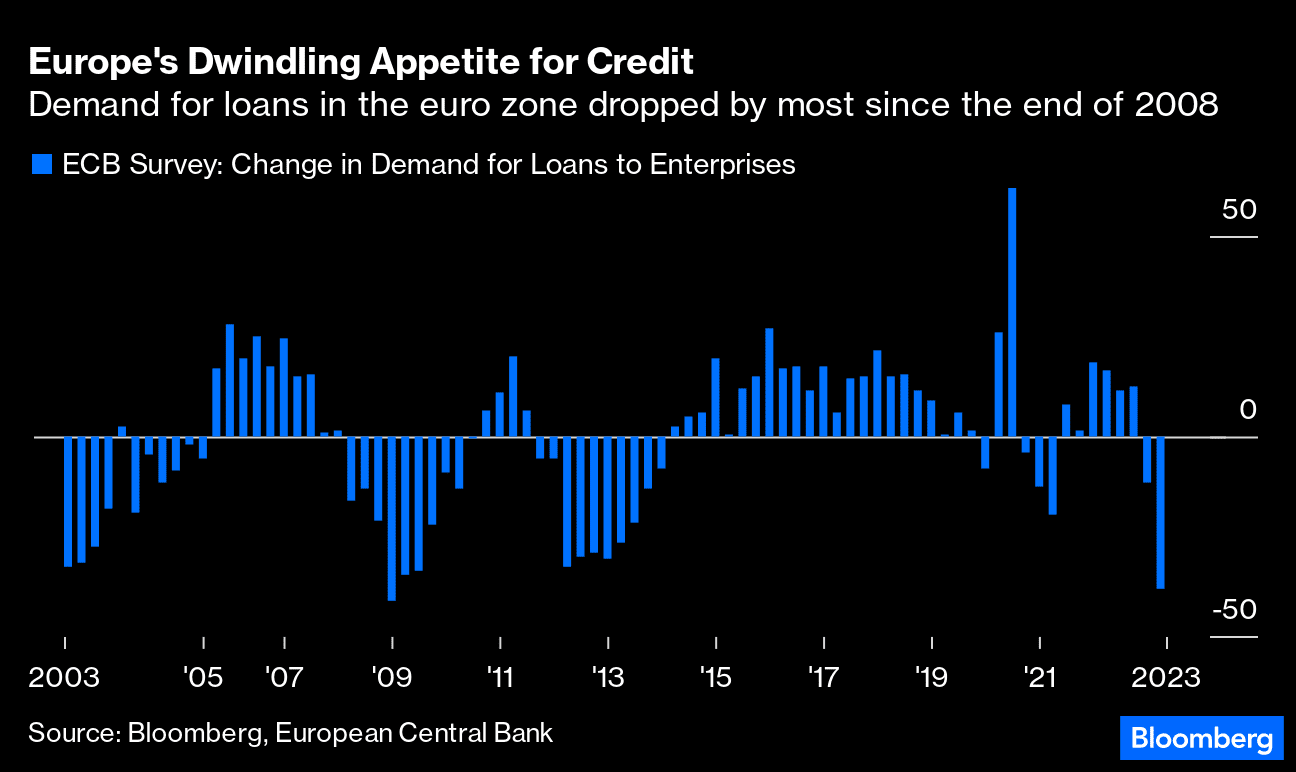
Aynı durum Amerika kadar kötü olmasa da Avrupa bölgesi için de geçerli. Aşağıdaki grafiklerde Avrupa’daki kredi taleplerini ve kredi vermekteki sıkılaşmayı görebiliyoruz.
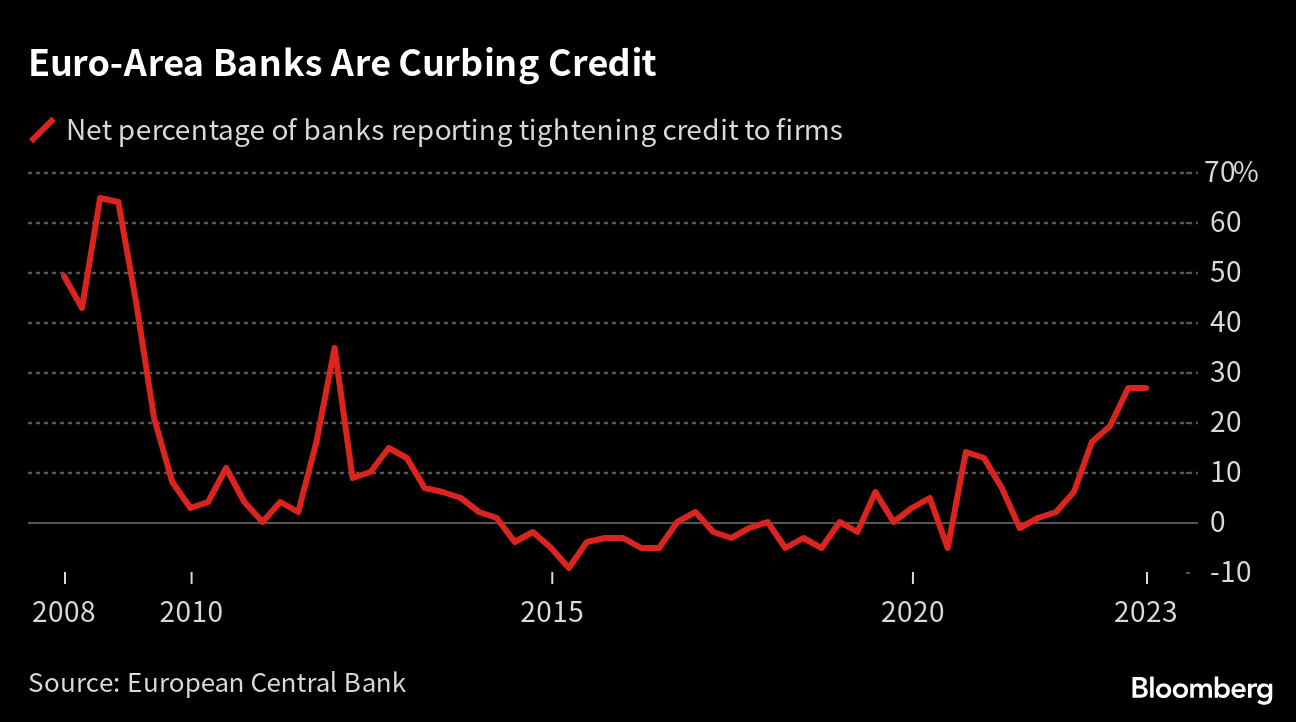
Özet olarak FED ve Avrupa Merkez Bankası artık kredi vermek istemiyor ve kolay şekilde para dağıtmaktan kaçınıyorlar. Çünkü ekonomik gidişatın kötü olduğunun onlar da farkında ancak bunu yanlış veri ve farklı açıklamalarla gizliyorlar, oyalamaya devam ediyorlar. Bu verilere bakarak global ekonomik gidişatın kısa sürede iyiye gitmeyeceğini anlayabiliyoruz. Bütün yatırımcıların bütün bu durumları göz önüne alarak plan yapmasında fayda olacaktır.